Words by: Anne Lee
Adeep dive into Lincoln University Dairy Farm’s data sets is offering Canterbury farmers insights into what to expect and how they may be able to profitably offset likely pasture production losses expected from the government’s new farm input control – the 190kg/ha/year nitrogen cap. While others were taking up crafts or completing 5000-piece jigsaws during Covid-19 lockdown, DairyNZ scientist David Chapman’s pastime was to crunch the numbers from the myriad of LUDF data sets. They included 2500 grazing events and 1800 fertiliser events.
His specific focus was to interrogate the data on the farm’s shift from using 300+kg/ha/year of nitrogen fertiliser to 168kg/ha/year as it moved to a lower input farming system that also saw a reduction in stocking rate.
Among his surprising finds were a smaller drop in pasture production than expected, a big jump in nitrogen use efficiency and the discovery of previously wasted opportunities for pasture utilisation and feed conversion efficiency.
David was quick to point out there was no simple cause and effect – taking out the nitrogen didn’t simply lead to single outcomes.
“Less nitrogen means less pasture growth and that ripples through the system in different ways.
“It’s important to understand it’s not just a case of pulling out some nitrogen and carrying on as usual.
“Some other adjustments have to be made to the system to keep things sweet,” he says.
During the higher nitrogen use years, the farm grew 20.4 tonnes drymatter (DM)/ha/year but during the lower input years that followed it has grown an average of 18.9t DM/ha/year – so 1.5t DM/ha/year less.
By David’s reckoning though – based on his analysis of nitrogen use efficiency – the reduction in fertiliser should have equated to a drymatter production drop of 2.5t DM/ha/year.
“Something is going on here that’s buffering the amount of nitrogen driven grass growth.
“Don’t necessarily assume that by taking out a proportion of nitrogen you’re going to lose all of the efficiency and productivity you were getting from nitrogen previously.
 “There are ways of getting it back – (or never losing it in the first place).”
The clues to that are in the data.
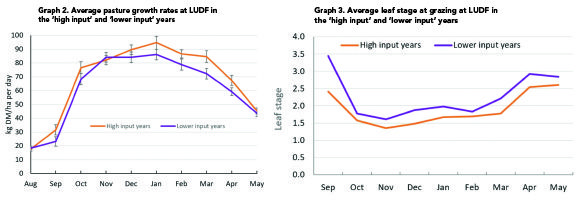
LUDF’s weekly pasture production data showed there was less pasture grown in all months of the year and the average round length increased by about four days in the lower nitrogen input years (Graph 2).
“That’s most likely because it was growing slower so to get the pre-graze covers wanted it took longer – you automatically go onto a longer round.”
Farmers should expect this sequence of events if they’re making big cuts in nitrogen fertiliser to meet the new cap limits. What surprised him though was the effect the faster rounds in the higher input years had on pasture harvested.
“When we took the information from our trial work at the Lincoln University Research Dairy Farm on leaf emergence rates we could back calculate the likely leaf stage at grazing (on LUDF just down the road).”
“These numbers really surprised me.
“For quite a portion of the year, during those fast rounds, we were grazing at somewhere between 1.5 and 1.75 leaf stage.
“Ideal practice is 2.5 to three – we were nowhere near it. Does it matter? I think it does.”
Since it made the change to lower nitrogen input levels, with longer rounds, the farm has been grazing more consistently at the 2.5 to three leaf stage and his calculations suggest that’s contributed an additional 1t DM/ha/year compared with if it had stayed at the same round lengths in the higher input years (Graph 3).

It looks like that’s significantly buffered what would have been a 2.5t DM drop, keeping it to a 1.5t DM reduction. LUDF’s nitrogen policy and longer round lengths have meant pre-grazing covers through till January have been higher during the more recent years. The farm team has still managed to achieve good post-grazing residuals from those higher covers though, thanks to the inclusion of tetraploid ryegrass cultivars in the mix along with diploids and clover. In 2010 20% of the farm was in tetraploids but by the 2018/19 season 95% of paddocks have the tetraploid/diploid mix. The palatability of the tetraploid encourages cows to eat right down into the sward while the diploid helps persistence. David says the data shows a small drop in metabolisable energy (ME) from 12.2 megajoules of ME/kg DM in the high input years to 12 in the lower years – a 2% drop.
Crude protein dropped by a much greater 11%, falling from 23.4% DM to 20.8.
“We think we can explain that by the longer grazing interval and re-growth interval.
“As grass matures through the regrowth cycle the crude protein concentration is diluted.
Older leaves are starting to mobilise some of the nitrogen in the leaf back into the plant and you have a better balance of young leaf and old, so the crude protein concentration comes down.
“That’s a good thing in terms of nitrogen surplus in the animal and nitrogen excretion.”
LUDF’s management team anticipated a reduction in pasture production when it shifted to lower nitrogen fertiliser inputs and reduced stocking rate from 3.9 cows/ha to 3.5 – a cut from 650 cows to 580. The start of seasonal nitrogen fertiliser applications was shifted from late July to late August/September when there would be a better response and late autumn applications stopped to limit potential winter nitrate leaching.
The longer rounds meant fewer grazings which in turn lead to 2.4 fewer nitrogen applications given the policy of following grazing with a nitrogen application. An average of 8kg N/ha less was also applied at each application too. The farm also moved to cut out nitrogen applications to its effluent areas.
Some of that shifted to being applied on non-effluent areas but with the new cap for each hectare rather than an average for the farm, that strategy won’t mean more than 190kg N/ha can be applied on the non-effluent areas.
Higher N-use efficiency
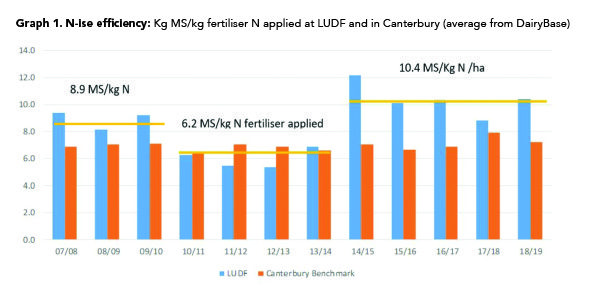
 David’s analysis found LUDF’s nitrogen use efficiency increased as it moved to the lower input system, lifting from 6.2kg milksolids (MS)/kg nitrogen fertiliser applied to 10.4 kg MS/kg N.
DairyBase figures show in Canterbury, the average milksolids (Graph 1) production per kg nitrogen fertiliser applied for the last 12 years was 7kg MS/kg N.
David cautions that the measure isn’t a response rate.
“I don’t want you to think that every kg N you apply will give you another 6-8kg MS – it doesn’t.
“It grows you another 10-12kg DM so maybe another kg MS (depending on how well you utilise the additional feed).”
The nitrogen use efficiency metric takes into account all the inputs and outputs of the farm system.
“We can see from LUDF’s data sets that it is possible to reduce nitrogen fertiliser and maintain a high level of productivity but it does require changes to the system.”
You will grow less feed but how much will depend on grazing management and how much your productivity and profitability are affected will depend on other systems changes.
Others’ experiences show big cuts to nitrogen fertiliser inputs can’t be made in just one season so to meet next season’s cap limit farmers need to be adjusting now.