Benchmarking a dairy business relative to its peers is an excellent way to guide a farm to its highest level of profitability, dairy consultant Chris Lewis writes.
As a dairy farm consultant my definition of the sweet spot is the farm system where an individual farm can consistently deliver its highest level of profitability.
A key word is “consistently”.
The farm system employed must be repeatable year-on-year, without deterioration of any farm resources. This means the quality of the cows, people, land, water and climate should not be eroded by the farm’s operation.
A huge challenge for dairy farmers is to determine if their business is in the sweet spot, and if not, “why?”
Benchmarking is an excellent place to start.
Verifying how well a business is performing relative to its peers is a revealing and challenging process. An open-minded approach is essential as farmers benchmark. They must be prepared to acknowledge that their farm is not in a sweet spot and change is required.
What makes this harder is that 80% of farmers believe they perform in the top 20%. Realisation for a farmer that they are not as good as they first thought, is unsettling. Those with the right attitude are galvanised by the news to do better.
An excellent starting point for dairy farmers wanting to benchmark their business is through Dairybase or they might use their financial statements and a few quick maths on a calculator to compare with the DairyNZ Economic Farm Survey. (Attached Table).
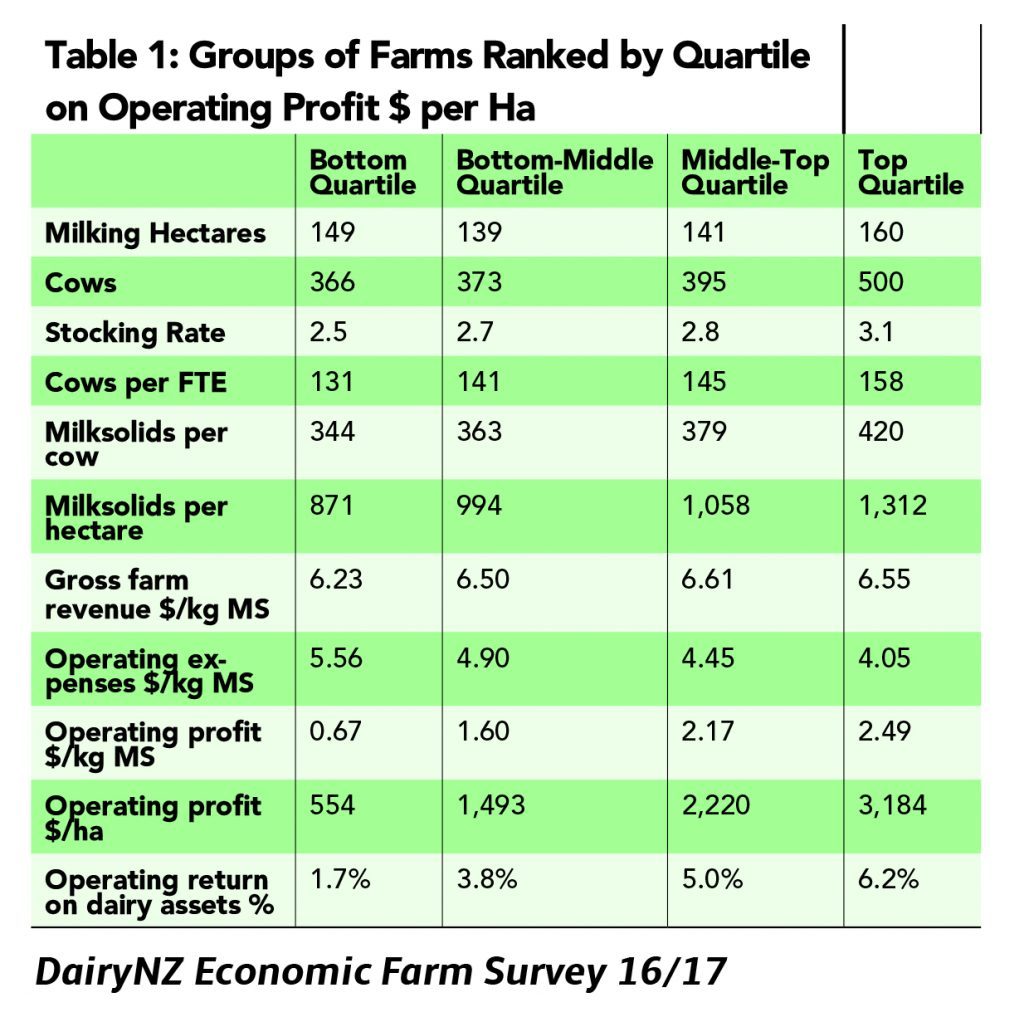
Table 1: DairyNZ Economic Farm Survey 16/17
In reviewing any credible New Zealand benchmarks a consistent finding is that the highest quartile profit farmers have a higher stocking rate.
In table 1 the upper quartile farms for 2016/17 were stocked 0.3 cows per hectare higher than the middle to upper group, and profit was $1000/ha higher. They not only had more cows, but had higher production per cow – 420kg milksolids (MS) – and a lower cost structure –$4.05/kg MS.
A dangerous response to this is to say “the sweet spot requires a high stocking rate”, so dairy farmers should just run more cows.
This is definitely not the answer for everyone, and in fact would probably lead to implementation of a totally unsustainable farm system.
Not every farm is going to deliver $5000 profit per hectare. The reality is not all farms have the same set of resources. So how do you identify the optimal point for your individual farm?
BakerAg and Macfarlane Rural Business are consultancy firms using a tool called Dairy System Monitoring (DSM) which includes the Farmax software, to record and analyse individual farm performance.
Among other outcomes it benchmarks and reports the results of individual farms. With two decades of information in this tool we have been able to identify the criteria, that if satisfied, are more likely to deliver an individual farm business into its sweet spot.
In the following table you will note that the top 10% of DSM farmers, ranked on earnings before interest and tax (EBIT $/ha), are again the highest stocked, consistent with the DairyNZ survey. But read on because we suggest stocking rate should be subservient to other traits demonstrated in the table.
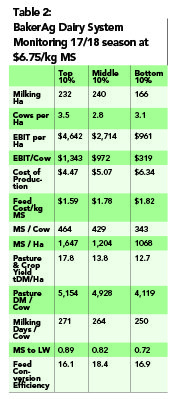
Our top 10% of DSM farmers do have a high stocking rate, but they also grow the most grass and crop. This group’s herbage production is superior per ha and, more importantly, per cow.
In fact, we advocate from this evidence that a profitable farm system is designed first around having the right amount of home-grown feed per cow.
Over a large number of seasons and payouts we have found the most consistently profitable farms have five tonnes of home-grown forage per cow. There are exceptions to this, but if you know how much feed you grow, divide this by five and you have a guide on stocking rate for the sweet spot.
Example: I grow 12t DM/ha, divide by 5TDM/cow = 2.4 cows per ha.
Let’s consider the other traits of our top 10% in the table, which must also be satisfied.
The top 10% have the highest milksolids per cow which is a function of having more feed, but also superior feed conversion efficiency. There isn’t the wastage or losses that would be seen on a less-profitable farm.
The cows milk longer. This is part of the efficiency story. There is less time in the non-lactating state, so more feed is being applied to the production of milk.
We know these sweet-spot, top 10% farms have good reproductive performance. Feed is not used on an animal that is slow to calve again.
The top 10% cow is also producing well relative to its liveweight, which is part of the sustainability story. This will not happen with a cow that is light in condition.
Our top 10% have the lowest cost of production, which in DSM includes wages of management and depreciation. This happens for two reasons.
The farmer has good discipline around spending. The operating cost per hectare is consistent with, or below what is expected for that farm system.
If the farm is in the sweet spot, costs are in sync with production and you get a low cost of production. I refer to this as the dilution factor.
BakerAg has examples of medium production farms, typically system 2/3, with a low-cost structure making high sustainable EBITs because of an excellent dilution effect. We also have high production farms system 4/5 with medium-cost structures deriving equally good EBITs. Again, it is the dilution effect.
To summarise the story so far. Top 10% farms have the correct number of cows relative to the amount of feed that is grown, good feed conversion efficiency (minimal wastage), a longer lactation length, cows performing well relative to liveweight and expenditure that is in line with milk production.
What system?
To explore who is making the high profits BakerAg has analysed the 2017/2018 DSM data to another level where it plotted expenditure per hectare (which tends to align with farm system types) and mapped this against milksolids production per hectare.
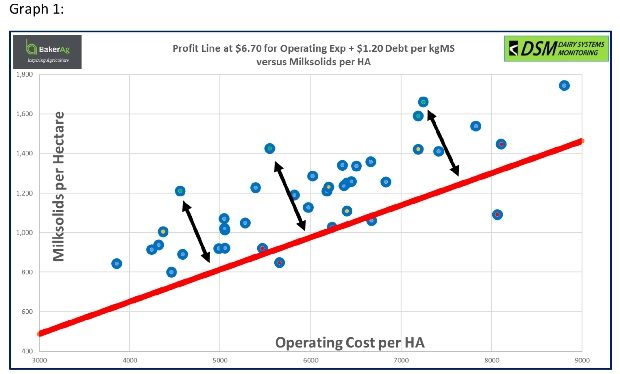
We then overlaid the data with a line that represents break-even for a $6.70 milk price. This is after meeting interest at a standardised $1.20/kg MS. The distance between the break-even line and the individual farm dot represents the discretionary farm surplus – cash profit.
This graph demonstrates that we had several businesses, three highlighted with arrows, that are delivering a similar level of “profit” despite being very different farm systems.
When we trialled different milk prices for this graph we found that for a payout between $5.70/kg MS and $7.70/kg MS, farm system type didn’t drive cash profit. This is a crucial finding because it says the current milk price +/- $1 should not be driving decisions around which farm system to use.
Any farm system is capable of generating a top 10% profit result. How well you implement the farm system is likely to have a bigger impact on profitability.
Where does this leave us?
If you want to get your farm business into the sweet spot, start with benchmarking the farms financial and physical performance. When you then look at the numbers, and find you are not in the top quarter don’t get trapped by a “more cows” response.
Look to define what resources you have to work with. The most important being home grown forage yield. Other indices around lactation length, feed conversion efficiency, reproductive performance, output per full time person in the business and others help to complete the picture.
It could be that you are using your resources efficiently, and while your profit is not “top quarter”, it is good relative to the resources employed.
If there remains a gap in performance, pull out a blank sheet of paper and consider what a farm re-design might look like. Look at the desired outcomes, then build out from these expectations to form a farm system.
Will the cost to run that system be in sync with production? If you don’t have the dilution effect, you will be pushing a square peg into a round hole. Get out another piece of paper, start again.
To conclude, the most important advice from all our work in dairy system monitoring: “once you have found the sweet spot – don’t muck around with it.” Meaning, if isn’t broke, don’t fix it. Get your business into the sweet spot and leave it there.
- Chris Lewis is a senior dairy consultant and director of BakerAg NZ.