Budgeting and benchmarking numbers form a feedback loop to look back and review the year’s performance, serving to inform decisions and add caution when metrics like payout and feed costs change. Ivan Lines looks back at 2019/20 for his Southland and Otago clients.
Agribusiness Consultants Ltd has for the last 15 years intensively analysed the productivity of its nearly 150 Southland and Otago dairy clients. This data forms the basis of monitoring productivity improvements and ensures our clients are objectively measuring their progress.
The review has become an annual highlight for clients as they appreciate the opportunity to reflect on the season passed and to take learnings into the new season. There is also a fair bit of competitiveness involved as the top client is identified and hosts a field day, and everyone wants to be better than the average.
In comparison to the year before, 2019/20 average milk production per hectare improved from 1417 to 1442kg milksolids (MS)/ha (+1.6%) even though average pasture utilised per hectare dropped from 13.54 to 12.78 tonnes drymatter (DM)/ha (-5.6%).
How did this occur? Average imported feed increased from 2.5 to 3.1kg DM/kg MS (+24%).
This includes nitrogen and an adjustment for feed on hand. Concentrate usage increased by 20% and silage fed increased from 312kg DM/cow to 350kg DM/cow. We produced more milk by buying in more feed to offset the reduced pasture production.
The reduced pasture growth for the region was also seen in the Woodlands AgResearch farm growing nearly 2.5t DM/ha less grass last season than its long-term mean.
Thankfully the payout allowed us to buy supplement to offset the poor grass growth. The margin of milk income over feed costs improved from $7837/ha to $8851/ha (for a fair comparison, both years are calculated at $7.15/kg MS).
We spent $318/ha more on feed, and made another $1014/ha due to the higher payout.
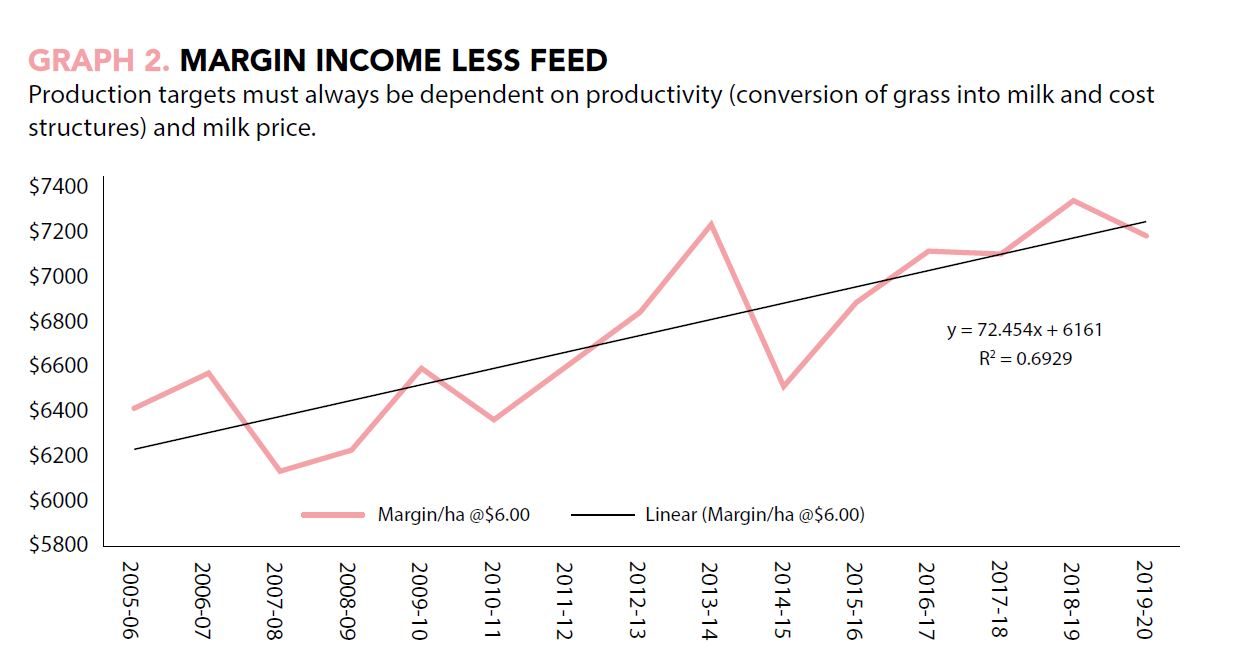
These are great results, but we do need to be cautious as this was payout driven. If the payout had been $6.00/kg MS in both years then we would have earned $156/ha less this year. Production targets must always be dependent on productivity (conversion of grass into milk and cost structures) and milk price.
Other interesting trends between 2018/19 and 2019/202 included a decrease in empty rates from 13.4% to 12.0% and an improvement in six week incalf rates from 70.9% to 71.6%.
There could be many different reasons for these improvements including better cow condition at calving and better nutrition premating.
Although per cow production for the season was similar to last year (471 vs 469kg MS/cow), daily production at mating was lower than the previous year (cows caught up because of a good autumn).
Another possible factor is that milk urea levels were much lower last year than the year before. Overseas research shows high milk urea having a negative effect on herd fertility but the same relationship is yet to be reported in New Zealand dairy systems.
Since 2005/06, our clients’ average milk production has improved from 1138kg MS/ha to a record high of 1442kg MS/ ha in 2019/20. The DairyNZ Economic Survey quotes the average production for Otago/Southland at 1148kg MS/ha so the Agribusiness Consultants’ data by no means represents the average performance for the region, however, 15 years of data (and over 65,000 cows and 31 million kg MS) is significant and important trends can be observed.
Although feed inputs have increased over this time there has also been an increase in productivity. At a $6.00/kg MS standard milk price, milk income less feed costs has improved from $6384/ha to $7199/ ha (average of first five years vs average of last five years) – an 11.6% improvement or $72.45 per hectare per annum. That is, from a productivity point of view, Agribusiness Consultants’ clients are improving their net income after feed costs by about $14,500, year on year.
Average per cow production amongst clients has improved from 400kg MS/cow to 470kg MS/cow. Many of our costs in Southland are per head related e.g. winter grazing, animal health, breeding etc, so it makes sense to improve production per cow to dilute these costs per kg of MS. It costs the same to winter a cow whether you get 400kg MS or 500kg MS out of her – so long as good pasture utilisation is maintained.
The average utilised pasture has improved from 11.35t DM/ha to 12.56t DM/ha (five-year rolling average) or a 10.7% improvement. Some of this is due to improved pasture production but mostly due to improved management and utilisation over that 15 years.
As feeding levels are improving, production is going up as are cow weights. Fifteen years ago the average estimated liveweight was 470kg, it is now 485kg – not a lot more, but a trend nonetheless.
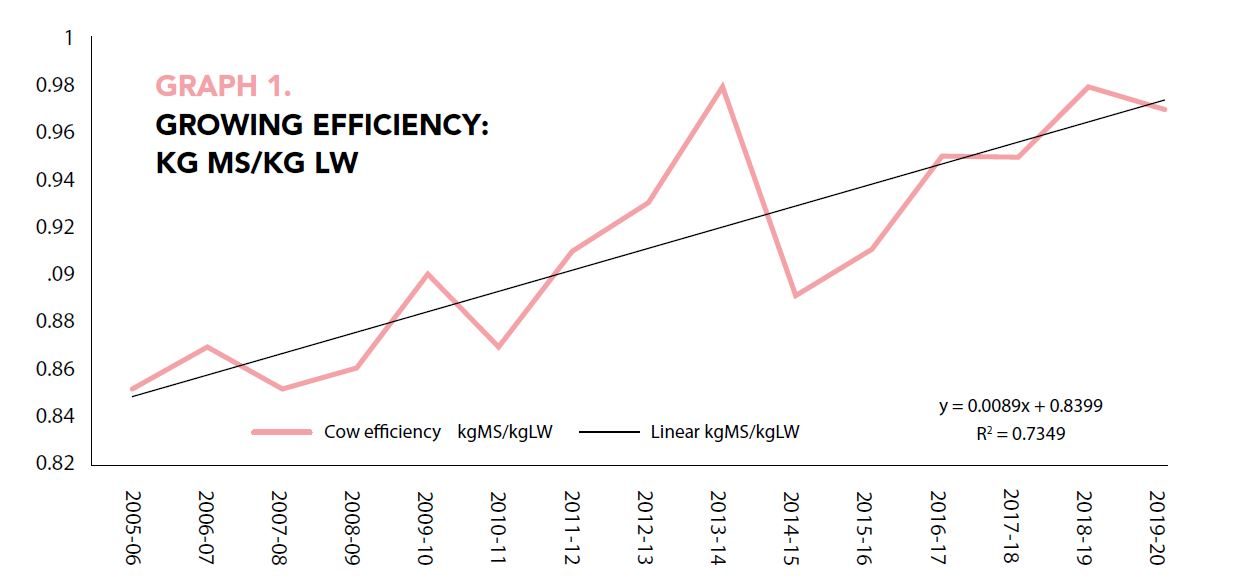
Pasture utilisation is and will always be the most important contributor to productivity and thus profitability – it has a correlation coefficient (R2) of 0.80 so we need to always keep our eye on the ball here. Another KPI that is almost equally as important (R2 of 0.73) is production per kilogram of liveweight (kgMS/kgLW). Over the last 15 years this has moved from 0.85 to 0.98kg MS/kg LW.
Even though our live weights are increasing, our milk production is going up faster – better feeding, better genetics and better management. Cows producing their liveweight is now commonplace amongst our clients and the best are achieving or closing in on 1.2kg MS/kg LW.
Southland farmers should be proud of their productivity improvements – we are getting more from less and cement ourselves at the top of the world in terms of efficient milk production.
- Ivan Lines is a consultant with Agribusiness Consultants, Invercargill