Louise Cook
A curious tension seems to exist between driving efficiency and conservative planning here on Owl Farm. These two ideas are often posed in opposition to one another, but they actually go rather well hand-in-hand.
This year we know we must take another step forward on driving efficiency harder, as we work towards further increasing our milk yields from homegrown feed. To do this we’ve spent the last six months looking at where and why we need to keep rather than trim a little fat in the system.
We’ve found over the last two springs that three things are critically important to get right for the start of season; an up-to-date feed budget, pasture cover at start of caving and body condition score at calving – now we’re making sure we talk about the third piece of the puzzle that sets us up for success.
High feeding rates will shorten the time for weight gain, but high feeding rates in autumn are for many, a luxury that isn’t budgeted.
Calving cow condition – the old chestnut is discussed every single year throughout the industry, but is one often missed in small or large part. More, it seems that very few of us have a record at a herd level of our performance, let alone at the individual cow level.
After a disheartening reproductive outcome for the farm last year where we scanned only 67% of the herd in-calf at six weeks (down 6% on previous) and scanned only 83% of the herd in-calf in total (down 5% on previous) we did a little digging on what went on. We know our results were comparable to many other farms locally and nationally, but that didn’t ease the pain.
What did we find?
We found a very low conception rate throughout mating of around 46% from day one to day 79, across all ages calving dates and CIDR cows (down from 55% the previous year).
We looked at production – cows were producing more throughout spring than previous years, and right through mating – suggesting they were better fed.
We looked at Body Condition Score and despite having the best calving average BCS in the last three years, much of that was eroded through spring. At a herd level, we knew there were a large proportion of cows at or below BCS 4.0 at the planned start of mating, but it was after a torrid September so we knew part of why this was the case.
When you look at the issues and consider the wealth of research – it became obvious that sub-par BCS at mating was a contributor and as something we can influence it needed further attention. What we lacked was good data on which cows were at risk, what age, when they cycled, and their reproductive fate.
What did we change?
In March, we began a monthly process of individually scoring the herd, carried out by Peter Briston an accredited BCS assessor at Cambridge Vets. From this data we created dry-off guides in line with individual BCS targets based on age and calving date. This included seeing our incoming first-calvers and rising three-year-old second calvers each having a target BCS of 5.5 at calving and BCS 5.0 for the rest of the herd.
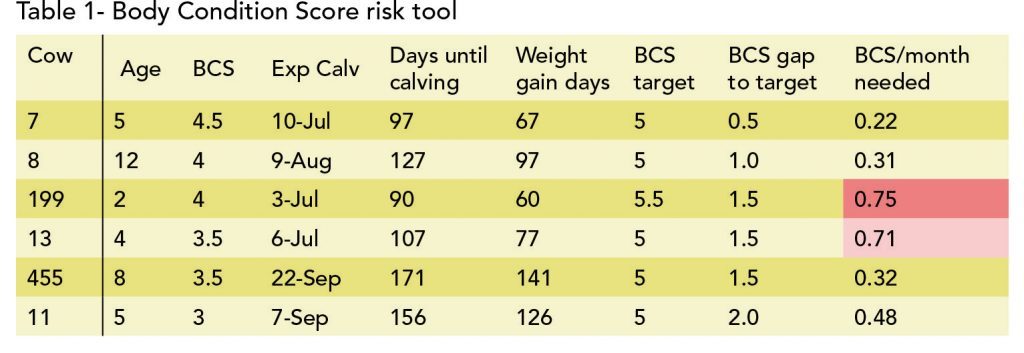
We always have a feed budget running so we knew we had enough feed available to add about two thirds (0.66 BCS) of a Body Condition score/month or 1 BCS every 47 days/7 weeks. In Table 1, cow 13 needs to gain 0.71 of a BCS/month or 1 BCS in 43 days – six weeks.
We created a tool to automatically rank cows based on risk – any cows who needed more than .66 of a BCS/month gain turned red and were dried off. Below is a selection of cows showing the range of weight gains needed and how a BCS 3.0 cow could stay in milk and one at BCS 4 was at risk of not meeting targets and dried off in the first wave.
This meant 120 cows were dried off in early April, another 100 on April 25 and the balance of the herd milked until May 9 when the feed budget called time on the season.
This mother and daughter combo seen here at BCS 4.0 in February – are 455 and 13 in Table 1; the same BCS, but one calves in early July and one in September. Based on the individual data one was dried off in the first group – the other in the last group.
Time is always the largest influencer of body condition score gain, with the squeeze applied by; the time taken to dry cows off and get them gaining weight, running the gauntlet up to the period where cows stop gaining weight as they near their calving dates.
However, time has a clear intersection with the amount of feed available in the feed budget for weight gain.
High feeding rates will shorten the time for weight gain, but high feeding rates in autumn are for many, a luxury that isn’t budgeted. Once dried off for seven days, our cows were offered around 15-17kg of feed (grass, low quality silage and palm kernel) for the remainder of autumn.
The most common question we received from our followers, was: “Why didn’t you feed them more when they were milking, so you didn’t need to gain as much weight in the autumn?” Fair question!
The answer? “We tried!”
Over summer, the heat stress here was considerable. Cows were hot. The intense heat grew a lot of grass, and burned the sugars out of the ryegrass making it high in fibre. It also caused an explosion of nasty C4 summer grasses that were also high in fibre. So our cows that were hot from the outside, were also eating highly fibrous feed that made them hot from the inside.
Offering more, just saw more left behind – which also posed a heightened eczema risk we didn’t want. We eventually made 110 tonnes of silage in February from all the extra grass we had around – three times more than we got out of our meagre spring surplus.
The herd was on once-a-day from Christmas and we had strong summer crops so we could offer up to a third of their summer diet in juicy, low-fibre turnips. But part of the carry-over effect of lower BCS pre-mating, meant they were starting behind the eight ball as we rolled into summer anyway. The other challenge was our system change, meaning for the first time we didn’t have 200t of maize silage on hand as a carbohydrate “helper” to gain autumn weight.
The results
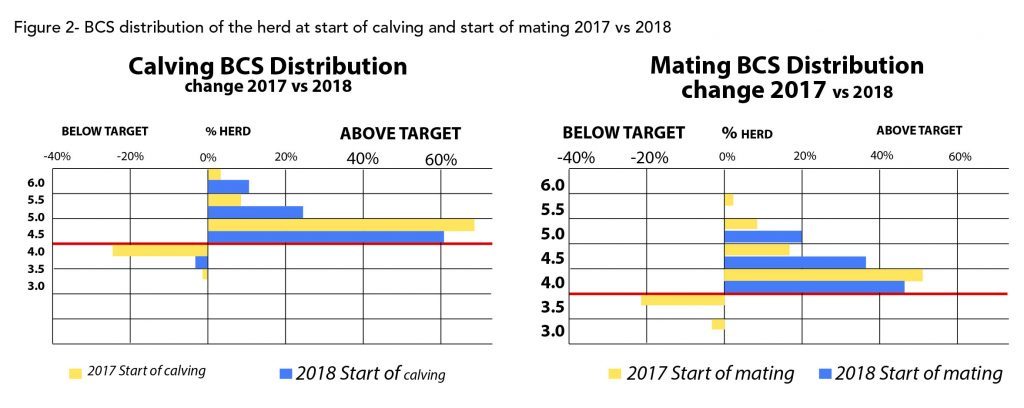
If we look at BCS average and more importantly range at both planned start of calving and planned start of mating – we’ve clearly made a little progress.
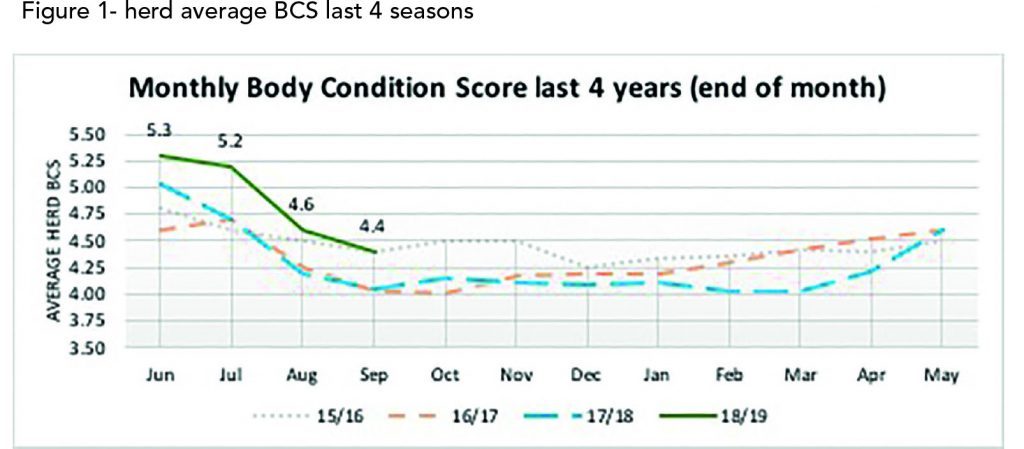
Our average BCS has had a much healthier start to the season this year, which has helpfully carried on so far this year leading to no cows below BCS4 heading into mating, compared to 25% of the herd last year. We’re now looking at this as a capital investment in BCS that we intend to maintain year-on-year a little like feed inventory. It’s part of how our system works now and needs to be carefully maintained each year.
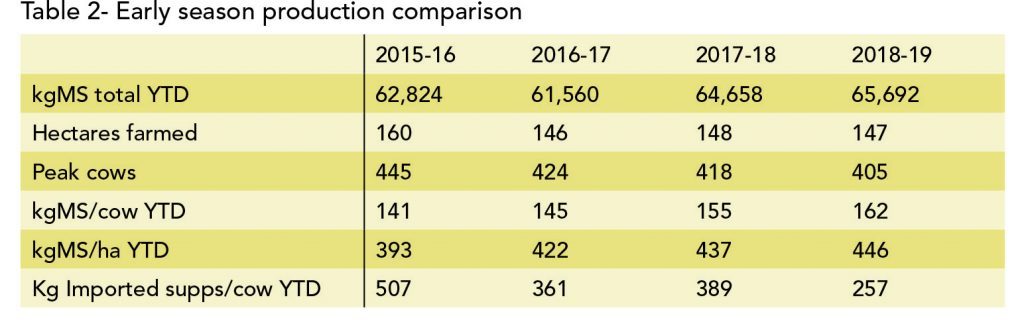
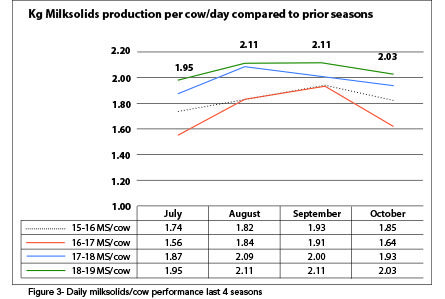
When we look at some of the other key statistics for the farm – it’s stacking up there too. Despite making less milk and drying off earlier last year, our profit last year was $50,000 higher than the year before (and that is putting both years at a $6.00/kg milksolids (MS) farmgate milk price to remove any effect of payout).
In this season – we’re 11 cows less on farm than last year, and so far we’ve made more milk out the gate (Table 2 and Figure 3). This is in no small part due to the extra “fat on the back” making it into the vat for the herd, plus a real focus on maximising feed intake regardless of the weather – as June, July and August were far wetter this season than last. However, September this year has been much more forgiving than last. The other pleasing point to note is that we’ve done it with considerably less imported supplements fed.
Lastly, mating performance – the reason that kicked off this whole process for us. So far, the signs are good – though as this is written we’ve to the day only completed our first three weeks. Pre-mating heats this year have been stronger – with more-obvious heats and more of them. This year all the paint is gone, where last year that wasn’t always the case (persistent rain throughout September may have played a part last year though.)
This year’s calving spread wasn’t as bad as we thought in the end, despite the 6% lower six week in-calf rate. Partially due to an 8% acceleration by the first calvers coming in quickly this year and use of a little more short-gestation semen at the 6th and 7th week of mating last year for the mixed age cows. Our six-week calving rate was actually 1% higher this year than last year (the same as two years ago) when it all ironed out, and with better BCS the pre-mating stats are very interesting reading (Figure 4).
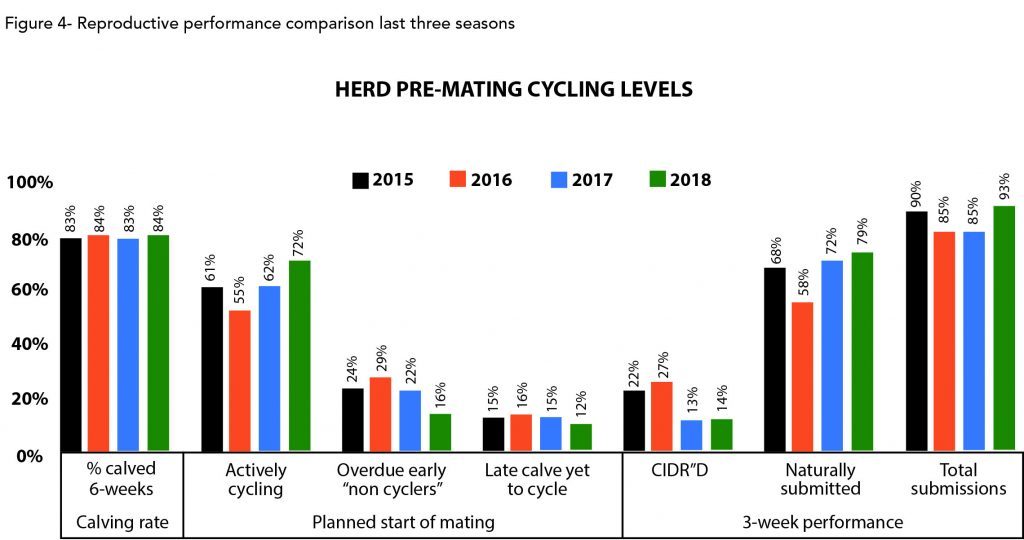
Pre-mating we’ve seen a dramatic increase in the number of cows actively cycling pre-mating, and even more of our later calvers cycling ahead of their “due date” eight weeks after calving. It’s also very interesting to note the comparison between early cycling and submissions four years ago and this year when cows started mating at better BCS than the two years in between.
We have used the same number of CIDRs this year on the herd compared to last year, however this year we inserted those 10 days earlier. Last year we delayed our CIDR insertion to the first day of mating to allow more cows to come on naturally. If we’d inserted 10 days prior like we have in every other year we would have used a CIDR on 69 cows (16% of the herd). Over time it is our aim and therefore pleasing to see the number of CIDRs required, coming down.
Just to compare – remember Mum and Daughter? (Big Ginge – #455 2009 born and BGD – #13 2013 born), well they have both been up in the first three weeks. BGD calved July 25 had three heats pre-mating and was inseminated October 10. Big Ginge calved September 8, had not cycled pre-mating but was inseminated October 11.
All up it feels like progress, and has reinforced to us that sometimes a little fat in the system is a good thing. Stay tuned to our focus day in March for the results and how big the dividend payable is, on this investment.