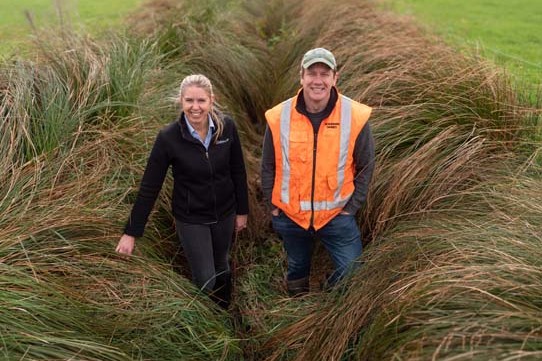
Marlborough farmer Joanna Grigg gets counting farm emissions and gets a pleasant surprise.
I was happy to get cracking on counting our farm emissions and sequestration when the call went out.
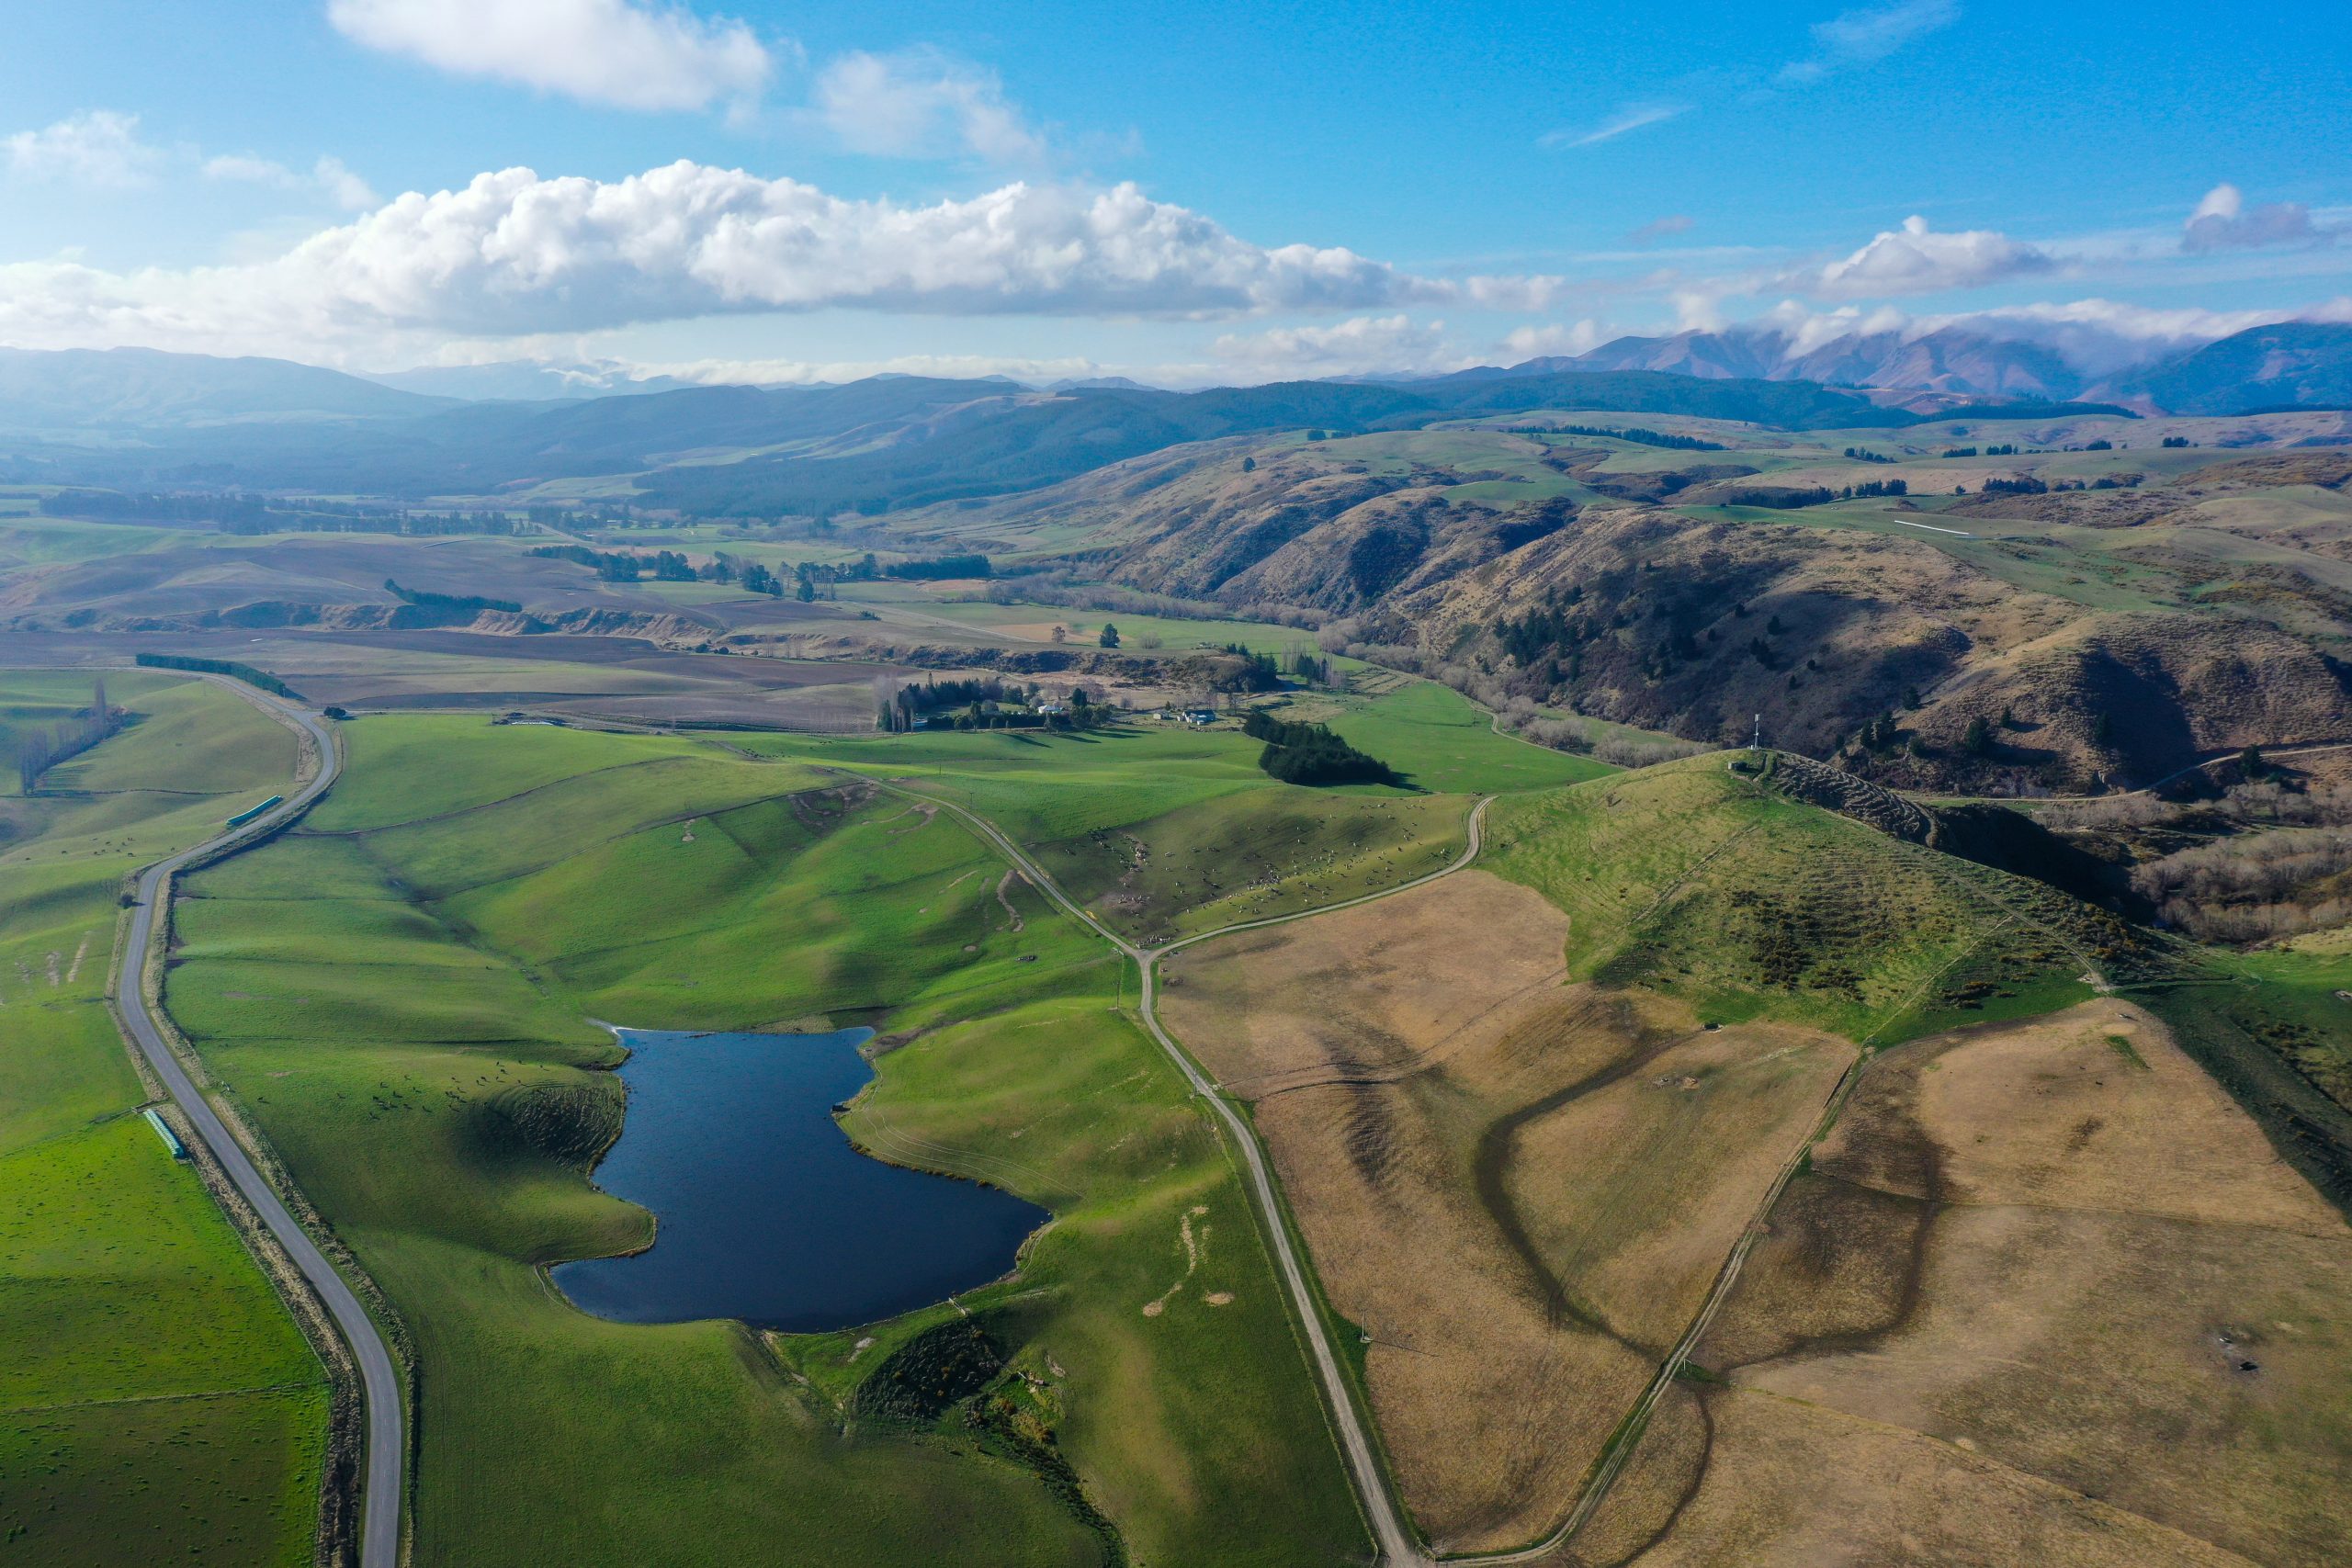
I was curious about how our 4600-hectare hill country farm (and 300ha lease block) might stack up using the Beef + Lamb New Zealand (B+LNZ) GHG calculator. With our woody weeds and significant kanuka forests we should be on the right side of the ledger, surely?
If farmers don’t run their Greenhouse Gas (GHG) numbers for their farm, then the appointed group working with government, He Waka Eke Noa, can’t say farmers have met their milestones and their part of the deal.
By the end of 2022, all farms need to know their GHG numbers. A quarter of us need to do it before December 31, otherwise primary industries run the risk of going back into the Emissions Trading Scheme (ETS).
When I rang Ben Hancock, who built the calculator for B+LNZ, he pointed out that the pricing mechanism for agriculture greenhouse gases is not settled yet. For this reason, it’s important farmers know where they sit.
The calculator results are stored by B+LNZ and confidential to farmers, he said. He reassured me it won’t be individually identified and sent to the government. No details of any farms are given to any parties, only the number of farms that have completed the GHG Calculator.
A corporate farming friend was nervous about putting the IRD number in, not wanting to be ‘bound’ by perhaps interim results. He can be reassured. Ben also pointed out that if the IRD number isn’t in, the property can’t be used in the sample. It’s a unique indicator.
I knew from our Overseer analysis done in 2019, when we did a Farm Environment Plan, that at 9800 stock units plus farm activities, our farm fart/burp/emits about 4000 tonnes of carbon dioxide equivalent each year. We had 100 R2 bulls that year too although never again, says the boss. We also grew cabbage seed so used more fertiliser.
When I calculated the hypothetical cost of offsetting these 4000t of emissions via buying carbon units through the ETS at the October $64 price, I suddenly got sweaty palms. That’s an annual bill of $256,000.
Threat of bankruptcy
After a restless night’s sleep and dreaming of swapping a town business for our farm, I tried to reassure myself that the intention is not to bring agriculture into the ETS 100%. This would bankrupt many farmers and be so dire for the nation that the government couldn’t possibly consider it. Would they? It would go against the United Nations call for climate change management to protect food production. Wouldn’t it?
Being Marlborough hill country, we have scrub and lots of it… except the GHG Calculator calls it shrubland which is a far kinder term. If our place is not carbon positive then most farms will not have a hope, unless they have exotic forestry.
Our family trust has had indigenous forest in a Permanent Forest Sink (now NZ ETS) since 2013. I recall our farm discussion group in the mid-2000s, staring up at a choked face of kanuka, pittosporum and bracken, and the consultant telling us we were looking at a fortune. He got it half right. It costs a bomb to keep what we have clear.
It took a lot of convincing the Ministry for Primary Industries (MPI), via lengthy mapping exercises and climbing through back-country with a hand saw to get tree samples, to get just 240ha accepted into the ETS. I learnt how to count tree rings. This earns us about 700 units a year – a pittance compared to Pinus radiata sequestration rates, but a handy income of about $42,000 at $60/unit.
We’ve tried three times since to get more recently regenerating areas within a possible 1500ha accepted into the ETS, but MPI has got tough. Too tough. ETS rules exclude so much regenerating forest on farms because they consider scattered trees as existing forest (pre-1990) by looking at shadows on maps.
We have scattered kanuka trees across much of our grazing land, for shade and on steep areas where the scrub rake couldn’t reach in the 1980s. But the ETS mapping rules consider the scattered kanuka join together to count as a forest in 1990 – so it’s exempt from being eligible to offset our emissions.
The B+LNZ GHG calculator is a completely different beast to the MPI ETS rules. It is serving a different purpose. Its goal is to paint a picture of a farm business.
A tree is a tree in this case. No sub-one-hectare limits and no 1990 cut-off for forest age. It’s more like a set of annual accounts.
It forgets the strict MPI rules of what is an eligible carbon sequestration plant and makes it far easier to find qualifying shrubs and trees to offset farm emissions. It is a simple ledger with stock and fertiliser emissions on one side, and forests, shrubs and shelterbelts on the other.
The sequestration rates are different too. The official line is that the He Waka Eke Noa minimum requirements include the expectation that peer-reviewed research is used to establish sequestration rates, rather than ETS rules.
I have to admit I was what Phil Journeaux, agricultural economist, AgFirst, predicted in his Review of Models Calculating Farm Level GHG Emissions Report, prepared for He Waka Eke Noa, May 2021. I was a confused farmer. I was trying to match the ETS rules alongside this different GHG calculator approach. They are different.
With that sorted in my head, I logged into the GHG calculator page and watched the seven video guides (well worth it).
First, the fert
The first step was entering fertiliser applications and that was easy. Cunning to put that first.
The next section vegetation floored me a bit. See Table A. We have large areas of scattered native trees like kanuka, mixed in with shrubland species that won’t make 5m like coprosma, tauhinu and muehlenbeckia and yes, bracken and barberry. Then I’m supposed to divide these shrubland areas into two categories; more than 30 years old or less than 30.
I know manuka is considered able to reach 5m. I’ll add kanuka to that too, as it’s hard to tell the difference. But how close together do different tree species need to be to make the 30% canopy cover? I was starting to wish I had a forestry degree.
The calculator user guide doesn’t have a list of what’s a tree and what’s a shrub and what’s not. B+LNZ based this section on the Ministry for Environment calculator and both are aware of needing to refine the categories.
I decided I didn’t have time to get a flash app to map the vegetation accurately (although they are in the pipeline, apparently). I decided to go really broad brush and figured that being ‘out a bit’ shouldn’t blow the equation. I based this on the fact that the sequestration rates for shrubland is low with the GHG calculator. It is 1.7t CO2-e /ha/year, while in comparison, the indigenous forest MPI tables for the ETS are about 3t/year, depending on age.
I reached for the best mapping document we have – our Farm Environment Plan.
The very athletic Suzie Le Cren, LandVison, had run around the property trying to get the trees sorted from the shrubs when she did the leg work for our FEP.
She said there was about 2900ha of effective area. But she also said 680ha of this actually had more than 50% shrub cover on it. But how old? I decided it was younger than 30 years, being on the clearer areas. Let’s call it that slow creep of tauhinu, young kanuka, coprosma and muehlenbeckia.
This leaves 2250ha effective. But looking around these best paddocks, they also have scattered shrubs. Even our best sub-clover lambing blocks are dotted with coprosma, manuka and muehlenbeckia. I tossed another 100ha in the shrubland column.
The FEP listed 1979ha of consolidated kanuka, manuka and shrub species. I took an educated guess and decided these shrubs would be more than 30 years and cover 300ha. This means our central forest is 1679ha.
Our ecology work in the area (as part of the Significant Natural Area process) says this is the last remaining tract of indigenous forest in the zone and some of it is original, so well over 100 years. So I play God again and call 30% older than 100 years and 70% younger.
Peripheral clearance fires were moderately successful in the 100 years of family tenureship but large areas were never burnt, according to family lore.
I started to worry that if I counted too much as shrubland, it leaves no expansion areas for the next generation for adding regeneration. Also, what if they want to bowl the shrubs because merino wool is $40/kg and lamb $15/kg? Would we have to pay back lost carbon?
Any areas in the ETS are out of the equation, as we’ve already counted and sold the credits. I took 240ha out of the column ‘Indigenous forest (less than 100 years)’.

Wool theoretically carbon positive
Wool is an interesting one. Currently it is not counted in the GHG calculator. I had a garment retailer who uses our merino wool ring me to say even after processing and transport, he can ‘theoretically’ offer a wool garment as carbon positive.
This is a great story for wool although I hear European legislation is not that favourable for wool over synthetics for GHG. Submissions have been made by NZ wool industry people to the European Union, as we tend to copy their regulations (another story). Over lockdown in Auckland he’d worked it all out.
The retailer then said he had spare carbon to ‘offer’ back to our farm system. But then I thought, hang on, when he buys our wool does he buy the sequestered carbon too for free? Should we charge him double the price? He was a little surprised when I brought that up.
I’m digressing.
The next tab on the calculator was entering the livestock opening and closing numbers. That’s pretty straightforward to do using the farm accounts or stock reconciliation.
The livestock movement tab is a good idea to capture stock trades and off-farm
grazing. We send about 1000 hoggets to vineyards over winter. I’m sure the wine company guys won’t be adding them into their GHG calculator so I decided we’d better not mark it as going off-farm.
I had a few red comments alerts on the Livestock Movement tab as I forgot to kill the 800 ram hoggets. Once I zeroed them on the closing, it seemed to balance. Good luck on your reconciliation… the hardest job on the farm.
The GHG calculator does not consider supplementary feed, cropping or vehicle use, so you don’t need to fill that in.
With bated breath I click results. It split the three main gases into methane, nitrous gas and CO2. This is then converted into CO2 equivalent (CO2-e).
All up, emissions are about 2840t. The stock figure tells me the total emissions (kg CO2-e) from the sheep and cattle are about the same. I was expecting the cattle to be much higher. Methane emissions are 92t but you have to multiply this by 25 to get the equivalent in CO2. No space to go into the rights/wrongs of this given the methane cycle. Our fertiliser contributes only 5% of our emissions.
Our vegetation offsets, not surprisingly, make us carbon positive – in other words we take more GHG out of the atmosphere than we pump in. To the tune of one tonne to the hectare (or-3200 net CO2 emissions). I wonder how many utes that might be? Our indigenous forest sequesters 4760t CO2/year and the shrubland 1340t.
Out of interest, I add another 100 mixed age beef cows and put those 100 R2 bulls back on, taking us over 8800 su. It doesn’t make much difference. Carbon positive by 2800t still. We should shout it from the rooftops. This classic hill country farm is carbon positive, using the B+LNZ GHG calculator tool. It will be interesting to see the final parameters they end up to measure this, though.
In the meantime, the farm is a super climate-change-friendly and environmentally superb space to grow food and fibre, and pump-up export earnings.
A parting thought, courtesy of Phil Journeaux: “Under the Zero-Carbon Act, methane cannot be directly offset by forestry sequestration, although all the models infer this is the case.”
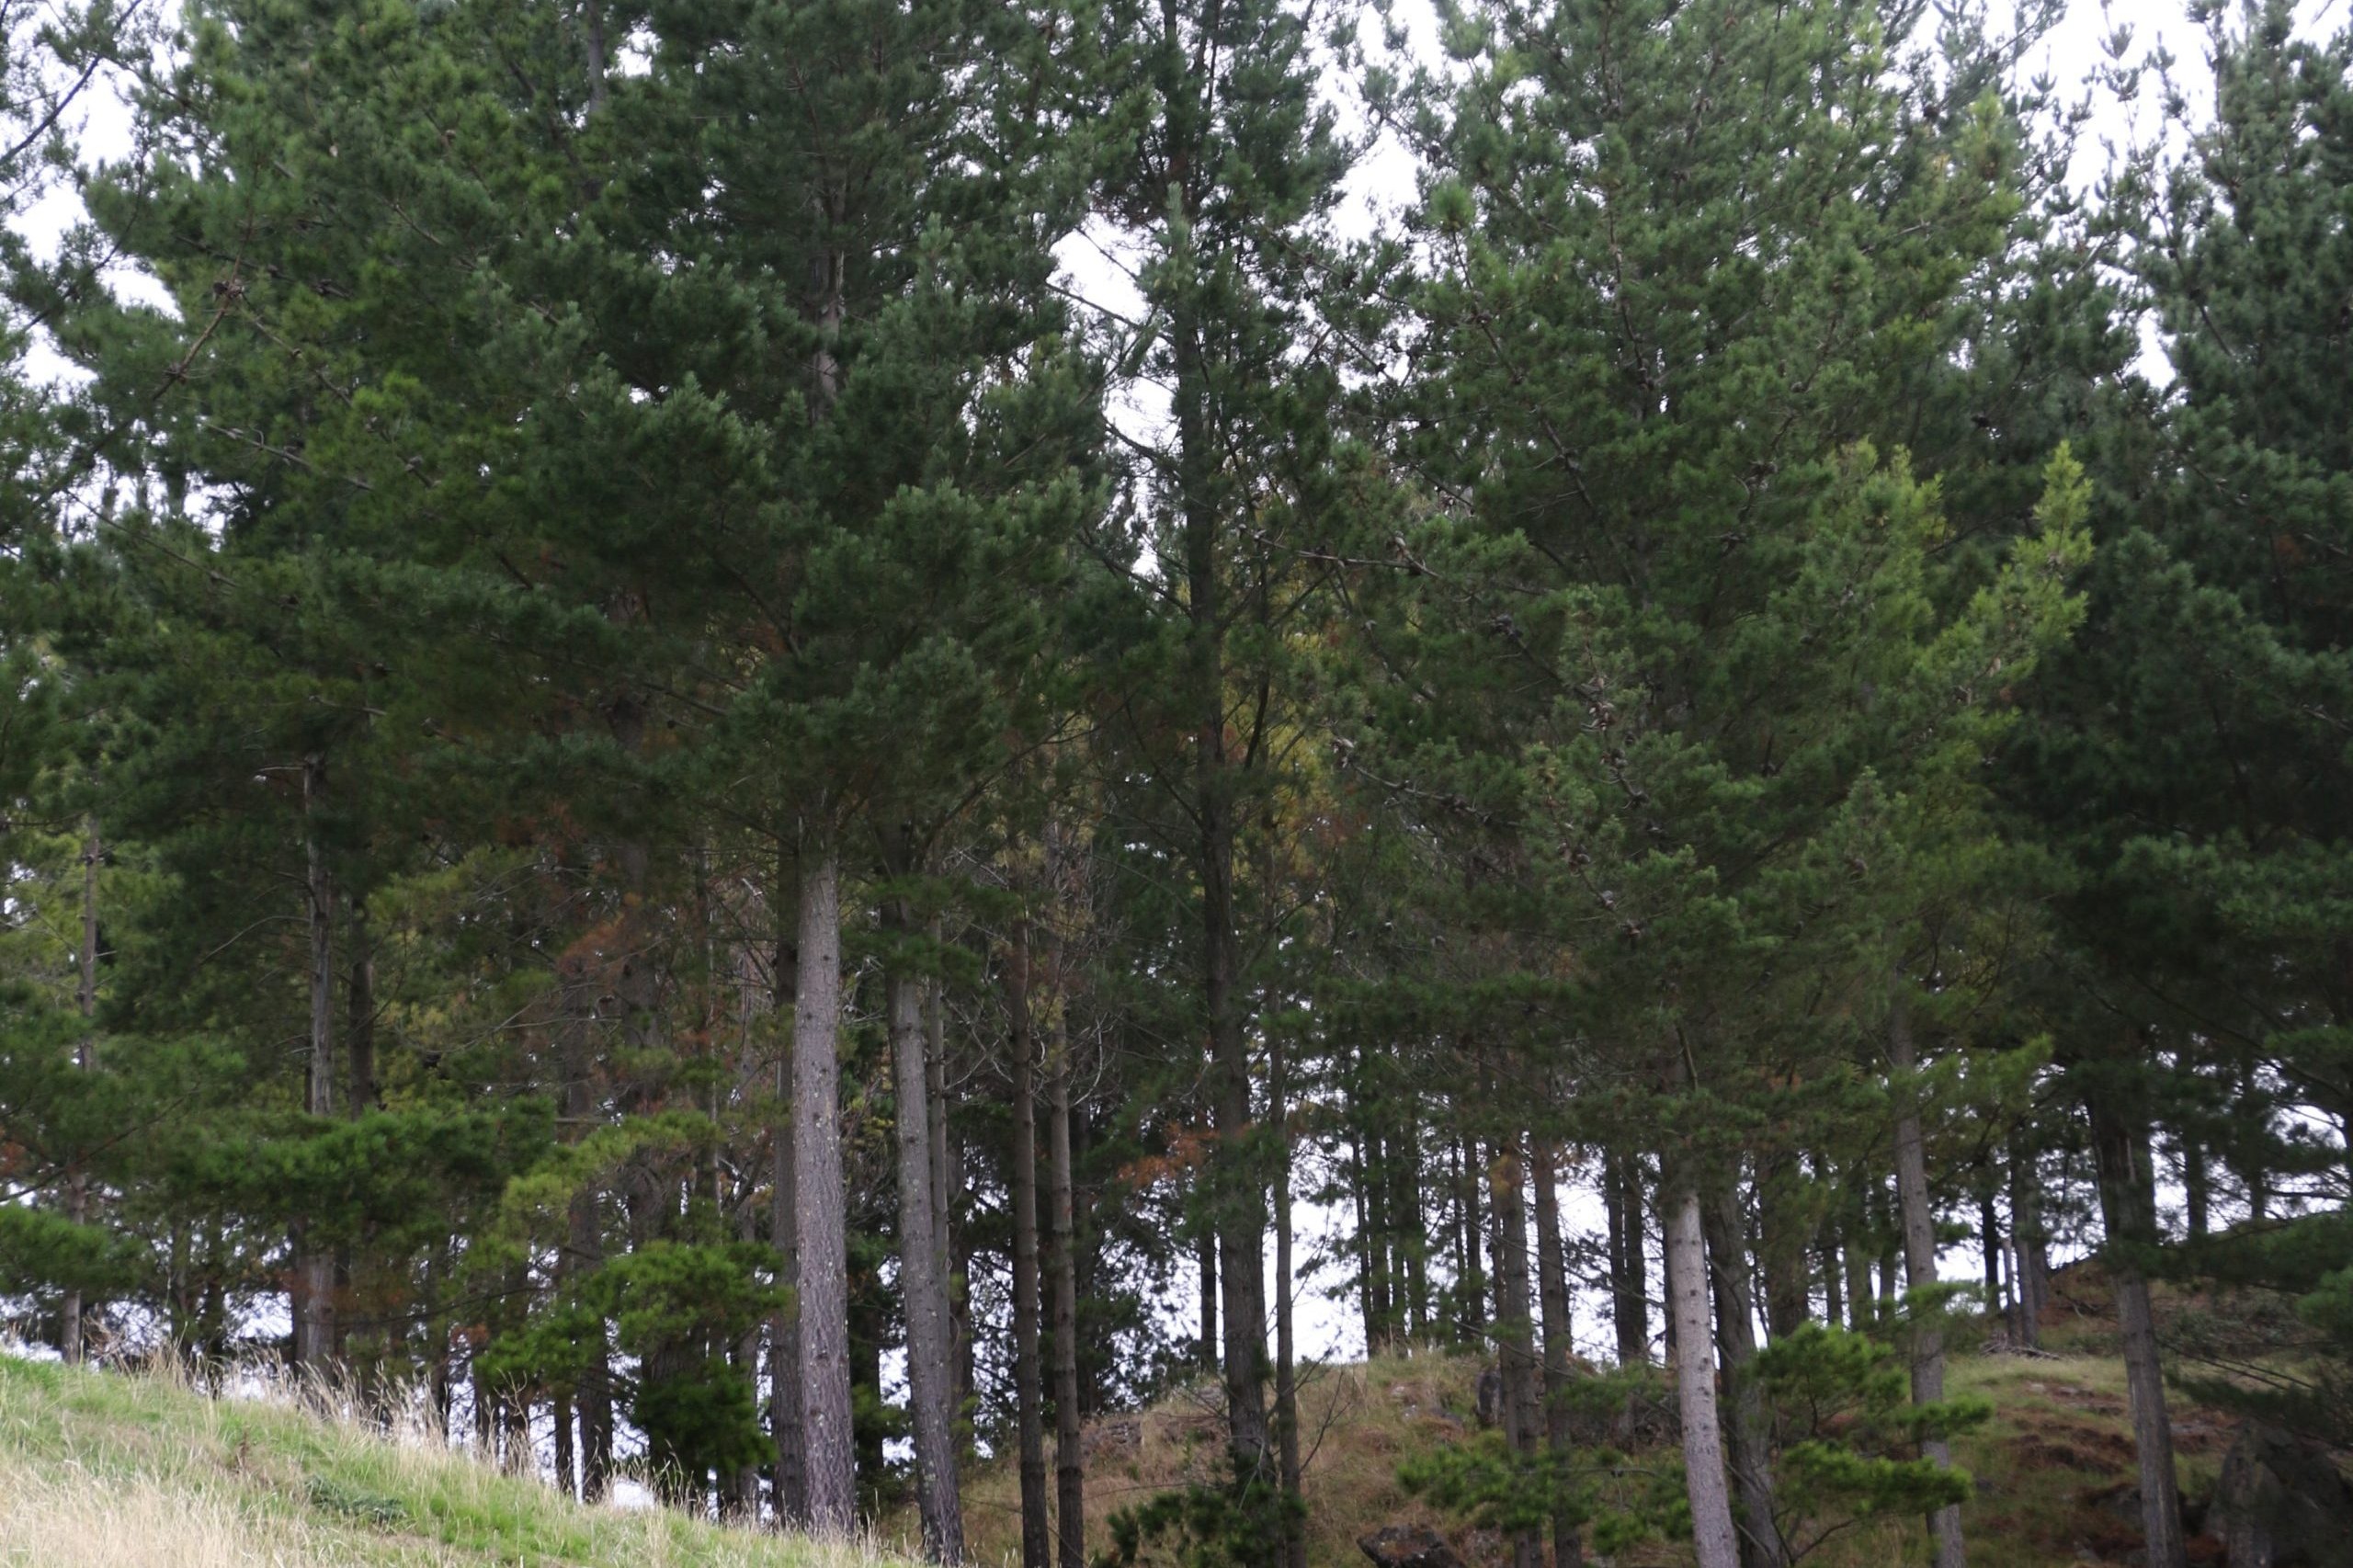
And here is a plug for planting indigenous long-term forests, like totara or kanuka. Under the averaging scheme for harvested pine forests, they only earn sequestration in the first 17 years. Then nothing up to harvest where you need to plant again. Indigenous plantings return over 100 years. This may be a better fit with succession planning.


