Manawatu dairy farmer Christine Finnigan started the Nguturoa Catchment group and now has a strong team of farmers working together for water quality. Jackie Harrigan went along to the catchment field day.
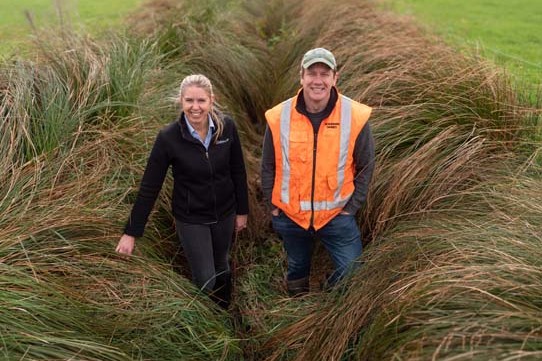
Christine Finnigan (pictured above with consultant Terry Parminter) floated the idea of a catchment care group three times at her local DairyNZ discussion group before the Manawatu dairy farmer decided to just start it herself.
Now the Nguturoa Catchment group has a thriving group of dairy, sheep and cattle farmers, lifestyle block owners and others on the Nguturoa catchment that runs off the ranges behind Linton and joins into the Tokomaru river before meandering down to the Manawatu River.
Now their SUB project – ‘Seeing, Understanding and Believing’ sets out to measure trends in the ecological health, nutrient levels and sediment status of the Nguturoa stream, directly linked to waterways draining from critical source areas on the farms and other properties.
Christine and two other landowners have developed farm plans to show how they are contributing to improving the waterways in the catchment as part of their farming business.
Finnigan Farms
Christine Finnigan farms 160ha at the foot of the Tararua Ranges in a family partnership with son James and daughter-in-law Hanna. They purchased the farm five years ago as part of their succession plan and farm a high breeding worth (BW) Jersey herd at a System 3-4 level milking once-a-day (OAD).
While the family can run 2.6 cows/ha on the farm, Christine says the Tokomaru silt loam is a poorly draining soil type not suited to horticulture and best suited to pastoral farming.
“We have to make the best of the land – and the best use is pastoral farming.”
Their goals focus around profitability and debt reduction, developing the farm infrastructure (fencing, drainage, water and effluent system upgrades), and preserving and enhancing the natural features of the farm (bush remnants, streams) along with family/hobby time.
The farm has an effective area of 140ha of which 56ha is rolling country with 7ha with slopes over 20%. The pastures are mainly ryegrass and clover.
Effluent is stored in a pond with a capacity of 2000m3 and is sprayed regularly on the effluent block. Waterways are all fenced and almost all races and culverts divert stormwater through the pasture. Fertiliser is applied in autumn, 400kg/ha of 15% potassic superphosphate onto the milking platform and a blend with extra potash onto the runoff. During spring about 40kgN/ha is applied following each rotation by the cows and in autumn dressings of 40kgN/ha go on each month, contributing to a nitrogen surplus of 114kgN/ha.
The Linton farm has natural features that Christine and the family were keen to preserve; like the lovely stand of native bush and the presence of freshwater mussels in the stream, along with kokopu (native fish) spotted in the stream on the neighbour’s farm.
Everyone in the catchment relies on each other – they are all interrelated, Christine noted.
“What we do in the top, the bottom and the middle of the catchment affects the whole catchment.”
“One of the things that I didn’t realise was that native fish move up and down the catchment – if they are not able to get in at the bottom they will not make it up to the top.”
“We need to measure water quality and use the science to know what to do in our patch.”
To this end, with the help of NIWA scientists and the support of the NZ LandCare Trust, the group is monitoring the water quality monthly by testing at two sites on the Nguturoa stream. Further funding from the Our Land and Water project under the National Science Challenges has enabled the group to extend the testing to look at three individual farms and their influence on the water quality. Christine says the water quality tests on the Nguturoa Stream through their runoff shows the farm appears to be adding additional sediment and some phosphorus but that most of the nitrogen measured to date is organic nitrogen rather than nitrate or nitrite.
“Over the next year we plan to complete the fencing of all the waterways on the runoff and add riparian planting for sediment and nutrient filtration and to increase biodiversity values.”
”It’s not hard if you break it down into small bits – we don’t have to fence it or plant it all in one year – in fact we now know that temperature is influenced by trees but grass is a very good filter so there might be some streams that are better filtered rather than having trees on them.
“We want to know what is going into the stream and what effect it is having on the life of the stream, especially the invertebrates, and what actions will make a difference – this will take time.”
Members of the catchment group are nervous about creating a weed and pest corridor up and down the catchment.
“I can see that we will be spending a bit of time on weed control.”
“Blackberry and other weeds like gorse control will be the next thing to crack into on our list of risks.
“We have ticked off some of the big risks like effluent areas, a standoff area, effective irrigation, minimising cropping and using wetland areas to capture nutrient.”
‘Everyone has different skills, so if we work together each of us can make a difference so that one plus one equals three.”
Part of the plan is some members propagating trees in a plant nursery, growing short term trees and longer term trees, starting up a pest trap library and executing more fencing along with the monthly testing.
Finnigan Partnership:
Total farm area: 160ha Eff area: 140ha Milking platform: 115ha
Milking cows: 300 cowsBW/reliability: 190 / 60% Production: 125000 kg MS 1100kg MS/ha 420kg MS/cow Average calving date: 28 July Drying off date: 25 May
Average pasture: 13,000kg DM/ha/yr 5ha summer forage rape 5ha summer turnips
Supplements made:80/90 tonne DM PKE used: 180 tonneHeifers: grazed off Dry cows: 200 on runoff, 100 on standoff pad.
Overseer Results:
Nitrogen surplus: 114kgN/ha N loss leaching: 29kg N/ha
N use efficiency: 34%(efficiency of N product from N inputs)
Phosphorus loss:1.2kgP/ha
Total Greenhouse Gas (GHG)emissions: 1386 CO2e tonnes/yr 8.7kg CO2e/kgMS 8,663kg CO2e/he/yr
Methane: (rumen activity) 68%NO2: (mainly animal dung) 19%
CO2: (energy) 13%
Find your farm’s Critical Source Areas
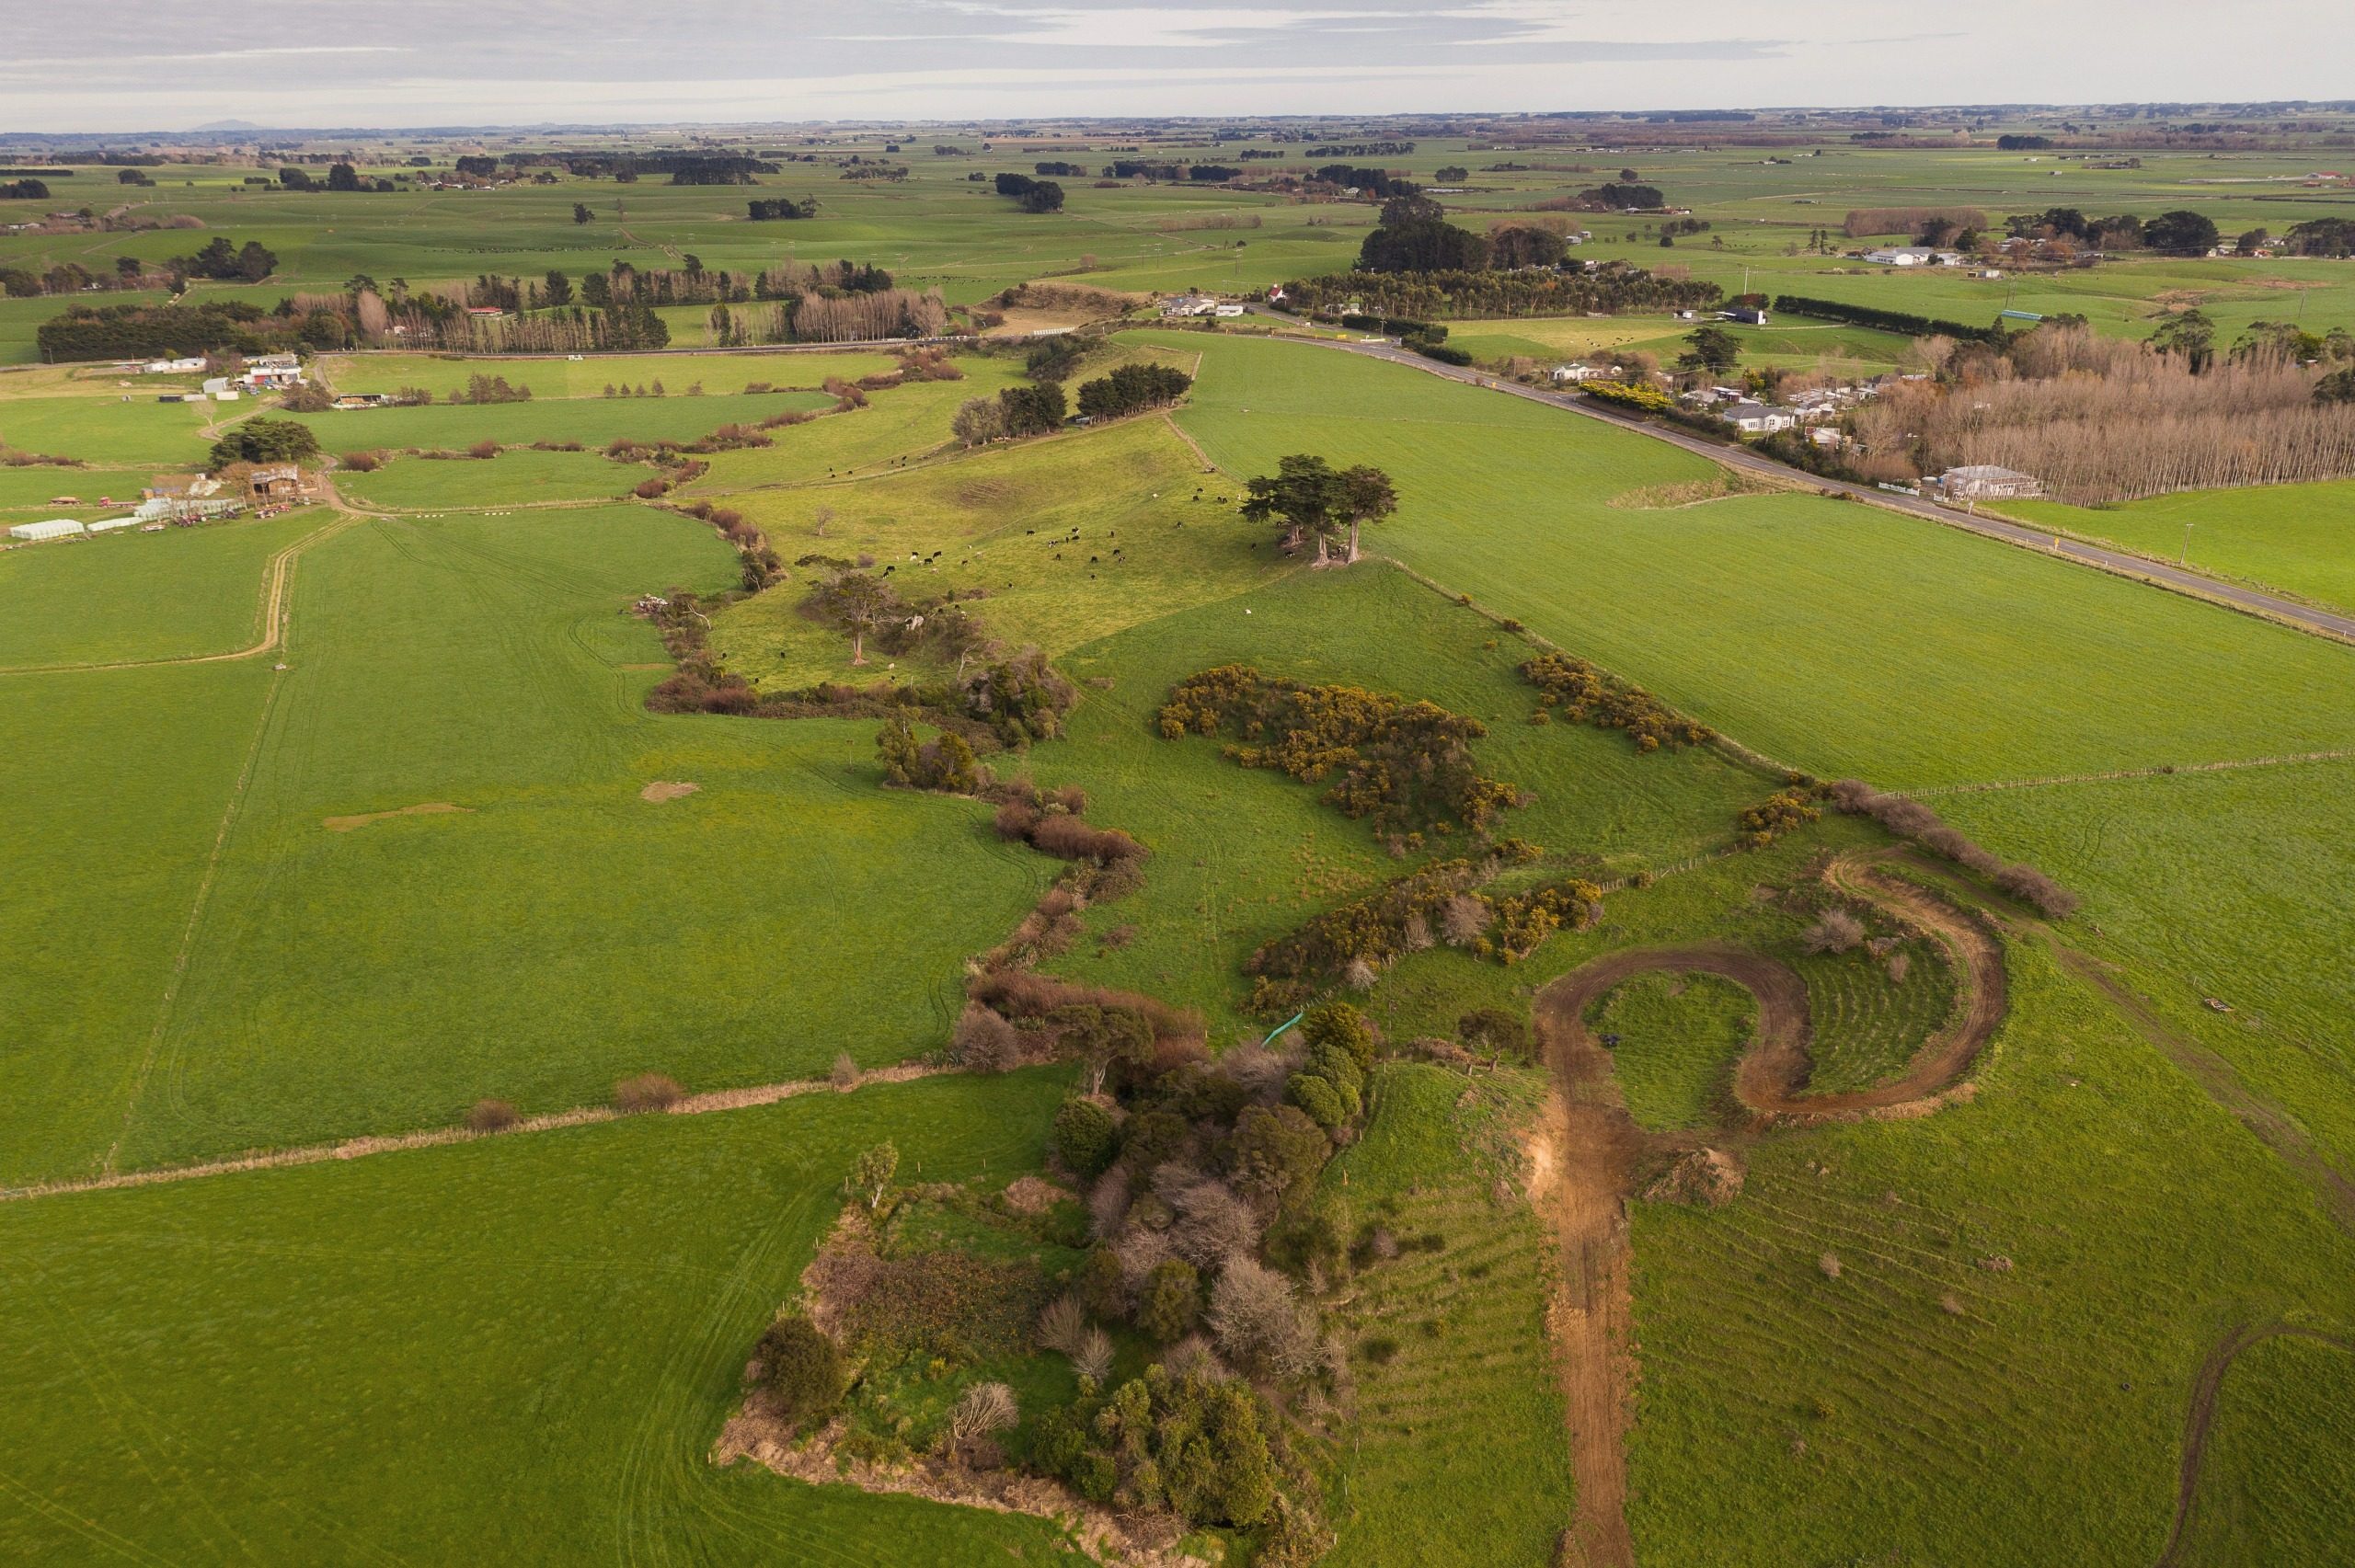
A critical source area is a small part of every property (eg 20%) or catchment area that contributes most (eg 80%) of contaminant losses. Rich McDowell from AgResearch told the Nguturoa Catchment care group field day that it is important to know where each property’s CSAs are and to apply mitigations to them based on the cost-effectiveness and ease of implementation, saying it will be 6-7 times more cost-effective than a blanket approach.
Potential critical source areas on the Finnigan farm:
• Effluent is currently stored and treated – for this farm at the farm dairy in lined ponds and applied to paddocks only when soils are below field capacity.
• Historical effluent ponds: these may leak into the groundwater – over time these are being allowed to silt-up and this is being accelerated by adding raupo along the edges.
• Silage is being stored – in this case more than 25m from the nearest waterway and stormwater runoff is kept at the silage stack.
• Stormwater from vehicle races and stock lanes: on this farm stormwater runs off tracks across nearby paddocks or is diverted across paddocks to slow sediment.
• Stormwater from State Highway 57: this is a likely source of sediment and heavy metals – zinc and copper. At present some of this is being diverted by NZTA through culverts and into streams running through the farm.
• Water running off down steep slopes. This may be a problem if winter grazing removes the vegetative cover and pugs the soil. On this farm 2/3 of the herd are winter grazed mainly on pasture through the flatter runoff block paddocks. The rest of the herd maintain pasture cover on the milking platform and are kept on the standoff pad during adverse conditions.
• Vehicles and livestock crossing waterways. All waterway crossings have been culverted.
• Direct access of livestock to streams. All streams are fenced.
• Streambank erosion. The waterways on the milking platform where this may be a problem are being fenced off and the riparian areas are being planted.
• Cultivation during cropping. Full cultivation is only carried out when paddocks have become ‘runout’. Otherwise, direct drilling is used to reduce the risk of wind erosion.
Where to find more information
To see if there is a community-led catchment group in your area, contact your regional Landcare Trust NZ office or check out their interactive National Community-led catchment groups map. www.landcare.org.nz/completed-project-item/catchment-groups
Our Land & Water National Science Challenge – Toitū te Whenua, Toiora te Wai have provided a repository of resources for catchment groups and catchment planning. Available at https://ourlandandwater.nz/get-involved/in-your-catchment/
For training, both Landcare Trust and the Mountains to Sea Conservation Trust can be contacted. The Mountain to Sea Conservation Trust, with the support of the Department of Conservation, runs Whitebait Connection all year round across seven regions throughout NZ. https://www.whitebaitconnection.co.nz/
Catching invertebrates from the stream
With help from NIWA scientists Juliet Milne and Amanda Valois, five rounds of water sampling have been conducted, two across a full suite of sites and the other three centred on two sites, a spring fed site at the top of the catchment and in the Nguturoa stream at the bottom of the catchment.
Conclusions from the testing were:
• Turbidity (a measure of cloudiness of the water related to visual clarity and suspended sediment) is consistently higher at the downstream site compared with upstream. Turbidity is highest when there is disturbance of the stream bed or bank (eg from stock access) and in wet weather due to sediment runoff and bank erosion.
• Nutrient concentrations are lower at the top of the catchment than the bottom. The median concentrations of nitrate-N (typically the boat abundant form of inorganic N in rural streams) is particularly low but concentrations will increase aswith the move into winter when soils are wetter and groundwater levels higher. Nitrate (along with ammoniacal-N and dissolved reactive phosphorus) is highly soluble and is rapidly taken up by algae and plants which can reach nuisance levels, and at higher concentrations than seen here can be toxic to aquatic life.
• E Coli: the median count at the downstream site was significantly higher than the upstream site. An indicator of faecal contamination in freshwater but warm-blooded animals such as humans, animals and waterfowl, the E coli level is useful for indicating suitability for contact recreation and other uses such as potable water or stock water supply.
• Nitrogen: The majority of nitrogen is organic N, which occurs in many forms – amino acids, proteins and urea, and is generally associated with soil or plant material, including runoff from land where manure has been stored. Although organic N is less readily available to contribute to algal blooms in streams, over time it should break down to nitrate, nitrite and ammonia and can contribute to problems downstream in lakes and estuaries.
• Ecological health: Benthic macroinvertebrates (small insects and other animals that live on the stream bed) were sampled at the top and bottom of the catchment in March, with the animals identified, and assigned a score based on NIWA’s SHMAK Macroinvertebrate Index. The top site was in ‘good’ condition and a number of species sensitive to organic pollution, including mayflies and caddisflies were found, along with koura. The lower site was in ‘fair’ condition (on the SHMAK scale). The site had poor habitat for invertebrates, with high amounts of sediment on the stream bed and excessive algal growth (which can lead to oxygen depletion overnight). There were some very small invertebrates – side-swimmers and worms, no mayflies, but a number of fish species were present including inanga.
Other information
The Stream Health Monitoring and Assessment Kit (SHMAK) manual describes the monitoring methods for each of the indicators used in the Nguturoa SUB project in more detail. A kit can be purchased from NIWA: niwa.co.nz/our-science/freshwater/tools/shmak/shmak-manual
There are also instructional videos to complement the SHMAK manual demonstrating correct procedures for carrying out the measurements for each component of the SHMAK, including the collection of water samples and managing your health and safety around rivers and streams. niwa.co.nz/our-science/freshwater/tools/shmak/videos
Mountains to Sea Wellington, in collaboration with Greater Wellington Regional Council, have developed a set of community-friendly resources for monitoring freshwater fish using both spotlighting and traps. mountainstoseawellington.org/monitoring-freshwater-fish/
Land, Air, Water Aotearoa (LAWA) is an information hub providing information on the quality of New Zealand’s freshwater, displaying data from over 1100 river monitoring sites. There are also fact sheets that provide information on water quality and the data presented, as well as a link to the National Environmental Monitoring Standards website. LAWA website and fact sheets: www.lawa.org.nz/
DIY in-river water quality monitoring:
Riverwatch is a new water quality monitoring service, combining a waka/pod collecting data that sits tethered in the river, and software/network ability to feed continuous real-time data on temperature, dissolved oxygen, turbidity, pH, conductivity and nitrates to a RiverWatch data portal accessed through desktop and phone app. Launched June 2021. More info: www.riverwatch.nz


