Bringing in more supplement will give more milk production per hectare but not necessarily put any more money in the bank. Anne Lee writes.
![]() The numbers tell the same story no matter where you are, Ireland, United Kingdom, Australia or New Zealand – increasing the amount of pasture harvested directly by cows increases profits.
The numbers tell the same story no matter where you are, Ireland, United Kingdom, Australia or New Zealand – increasing the amount of pasture harvested directly by cows increases profits.
DairyNZ dairy systems specialist Mark Neal and his Irish counterpart, Teagasc Moorepark dairy farm economics and sustainability researcher Laurence Shalloo shared long-term data from both sides of the world that told a remarkably similar story in terms of the extra profit likely for every extra tonne of pasture eaten and the extra costs that come with importing additional feed.
Both spoke at the Pasture Summit held in Hamilton and Ashburton late last year which attracted about 900 people across the two venues.
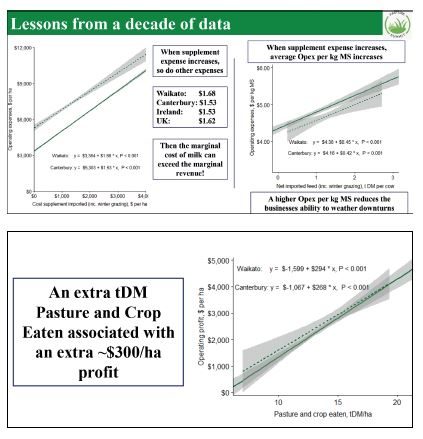
Neal used analysis of 12 years of data from DairyBase which showed that for every extra tonne drymatter (DM) of pasture and crop eaten in Waikato, operating profit increased by $294/ha.
‘But if you add in $1.23/kg MS of interest and rent – which is the South Island average – there’s not much daylight and if the milk price comes back down (to the lows of recent years) you’ll be looking for a snorkel because you’ll be under water.’
In Canterbury the same analysis showed an increase in profit of $268/ha.
Irish and UK data also show numbers very close to $300/ha.
“It might vary a bit from region to region or country to country and even from season to season but it’s always around that $300 mark,” Neal said.
Bringing in more supplement will give more milk production per hectare but as other studies confirm, that’s not necessarily going to mean more money in the bank.
Neal referred to a study carried out at Lincoln University by Wanglin Ma, Alan Renwick and Kathryn Bicknell, published last year in the Journal of Agricultural Economics.
They found that as the level of bought-in supplement increased and farms shifted from low-input systems one and two to medium input (system three) and then on to high inputs (system four and five), milk production increased by 66kg milksolids (MS)/ha and 149kg MS/ha respectively.
But they found no significant lift in profit or return on asset.
“While it wasn’t statistically significant, there was a numerical decline across that intensification,” Neal said.
“Why is that? It’s worth digging into that a little bit more.
“Let’s say you’re getting paid $6.25/kg MS for your milk and you bring in a tonne of PKE at $340/tonne landed and if that’s 90% DM and you get an 80g MS response there should be $1.50 margin in all that.
 “So why doesn’t it show up in the numbers?”
The answer lies in the fact the calculation relies on the assumption that for every dollar spent on imported supplement operating expenses go up by the same dollar.
“But what actually happens is that for every dollar spent on imported feed your operating costs go up by $1.53 if you’re in Canterbury.”
In Waikato it’s even greater at a $1.68.
The numbers come from analysis of DairyBase but are very similar to those coming from UK and Irish analysis.
“This is not some accidental statistical aberration. This is (based on) 12 years of data from here. In Ireland, at the current exchange rate their data shows $1.53 and the UK it’s $1.62.”
The additional cost comes from a variety of sources – more equipment for feeding out, more depreciation, maybe more labour or less efficiency.
Ultimately it can mean that instead of making money on the extra kilograms of milksolids produced it’s costing money.
On farms where no supplement is being imported the cost of production averages about $4.30/kg MS and for every tonne you import over that the average cost goes up by 40c.
“So if you import 2t DM there’s still a bit of daylight between there (total costs) and the average milk price.
“But if you add in $1.23/kg MS of interest and rent – which is the South Island average – there’s not much daylight and if the milk price comes back down (to the lows of recent years) you’ll be looking for a snorkel because you’ll be under water,” Neal said.
Higher operating expenses reduce the ability of the business to ride through the downturns or be able to take advantage of opportunities when they arise, he said.
Shalloo warned farmers that in analysing their business they needed to look at the right metrics – which notably weren’t production related.
Instead the focus should go on what the limiting factor is.
“Here (in New Zealand) the limiting factor is capital, in Ireland it’s land, so profit per cow is not a function you should be looking at in your business, it’s profit per unit of capital or return on assets (ROA) – and for us it’s profit per unit of land,” Shalloo said.
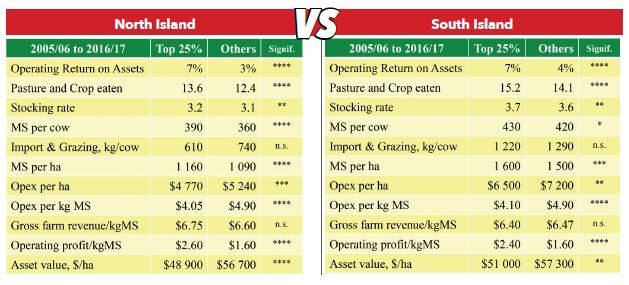
Analysis of the DairyBase data from 2005/06 through to 2016/17, comparing the top 25% of farming businesses with the rest shows a significant difference when it comes to operating ROA.
The top performers have an operating ROA of 7% when averaged over the past 12 years while the rest sit at about 4% in the South Island and 3% in the North Island.
“That’s the difference between making more than the bank and less than the bank,” Neal said.
But he also pointed out that back in the earlier years of the analysis and years prior, based on DairyNZ’s economic farm survey, capital gain was sitting about 5.5% over inflation which explained why ROA hadn’t been a key driver of change in performance.
 “If you take 4% and add 5.5% and that’s a pretty good return but in the last decade the average capital gain has dropped to 0.2% over inflation.
“And it doesn’t matter what number you add 0.2% to, the number doesn’t change much.
“If you want to be making more money than the bank, if you want to be growing your business, you want a high return on assets,” he said.
Looking further into the differences between the top 25% and the rest, Neal said the data showed the top quartile utilised 1.1-1.2t DM more than other farmers.
Their stocking rates were slightly higher and milk production per cow was also higher but it didn’t come from extra bought-in feed as the amount of imported feed was statistically similar between the two groups.
“But look at the operating expenses per hectare. The difference – it’s massive – $700/ha (for the South Island).”
The difference in operating expenses per kg milksolids is also significant at 80c in the South Island – $4.90/kg MS for the top quartile compared with $4.10. In the North Island the difference is 85c/kg MS – $4.90/kg MS for the top quartile and $4.05 for the rest.
Gross farm revenue per kg milksolids was not significantly different and if anything was slightly lower numerically for the top quartile group.
That reveals more about the difference in ROA.
ROA is total return divided by the asset value and given the total returns for the top 25% were similar or slightly lower the difference in ROA comes from having a lower asset value.
The top 25% had less cash tied up in land and improvements.
Neal said there were a number of aspects to that – it may be the quality of the land, its location, or greater investments in onfarm structures and infrastructure.
The Irish are coming
 Increasing pasture utilisation as a means to improve profitability isn’t a secret – the Irish are on to it too and already making gains on profitably expanding milk production following the abolition of quotas.
A Teagasc study of the Irish dairy farm database from 2008 to 2015 looking at the key drivers of profitability showed that increasing pasture utilisation had the biggest effect both per hectare and per kg milksolids.
Shalloo said the study showed that as pasture utilisation increases costs go up per hectare but down significantly per kg milksolids.
An increase in purchased feed of 50% – taking it from 1t to 1.5t/cow increases costs per hectare and per kg MS significantly with investments in buildings on farm of $1700/cow also leading to an increase in annual farm costs.
Increasing milk production per cow, while increasing per hectare costs, reduced per kg milksolids costs.
Looking then at the effects on profitability showed that lifting pasture utilised by 3tDM/year boosted profitability by $882/ha or 36c/kg MS.
Increasing purchased feed by 50% though would cut profitability by $165/ha and investing in additional buildings would reduce it by a $187/ha.
The study showed that increasing milk yield by 25kg fat and protein per cow boosted profitability by $139/ha.
“We have the idea that increasing milk yield is a bad thing but it’s not once it doesn’t come from bought in feed. So we’ve said increasing milk yield per cow is good but increasing purchased feed is bad.
“But what’s the easiest way to increase milk yield per cow? It’s to buy in feed. That’s why milk yield per cow isn’t a good KPI – it doesn’t explain the variation in profit and it gives the farmer the wrong signal.”
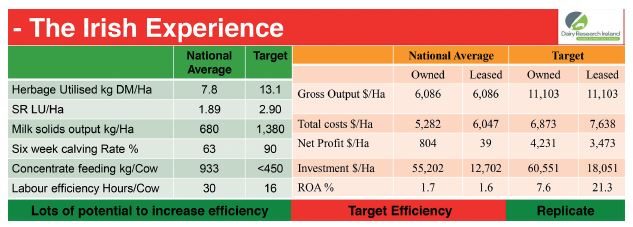
The Irish have set physical and financial targets for their industry and Shalloo was confident they were making steady gains and the direction of travel was positive.
Currently average pasture utilisation is about 8t DM/ha with the target set at 13t DM/ha.
Between 2008 and 2015 it’s gone up by 1.3t DM.
Stocking rate is 1.89/ha with the aim to get to 2.9 and six-week calving rate (not in-calf rate) is 63% with the aim of 90%. It’s lifted from 55% over the past six years.
The target is to profitably double milk production from 680kg SM/ha to 1380kg MS/ha while halving the level of concentrate feeding from 933 kg /cow to less than 450kg/cow.
More? See:
www.pasturesummit.co.nz/wp-content/uploads/2018/12/Workshop-1-Mark-Neal-DAIRYNZ-North-Island-Presentation.pdf