Benchmarking has helped the Woods keep their Pirinoa farm in top form, Jackie Harrigan reports.
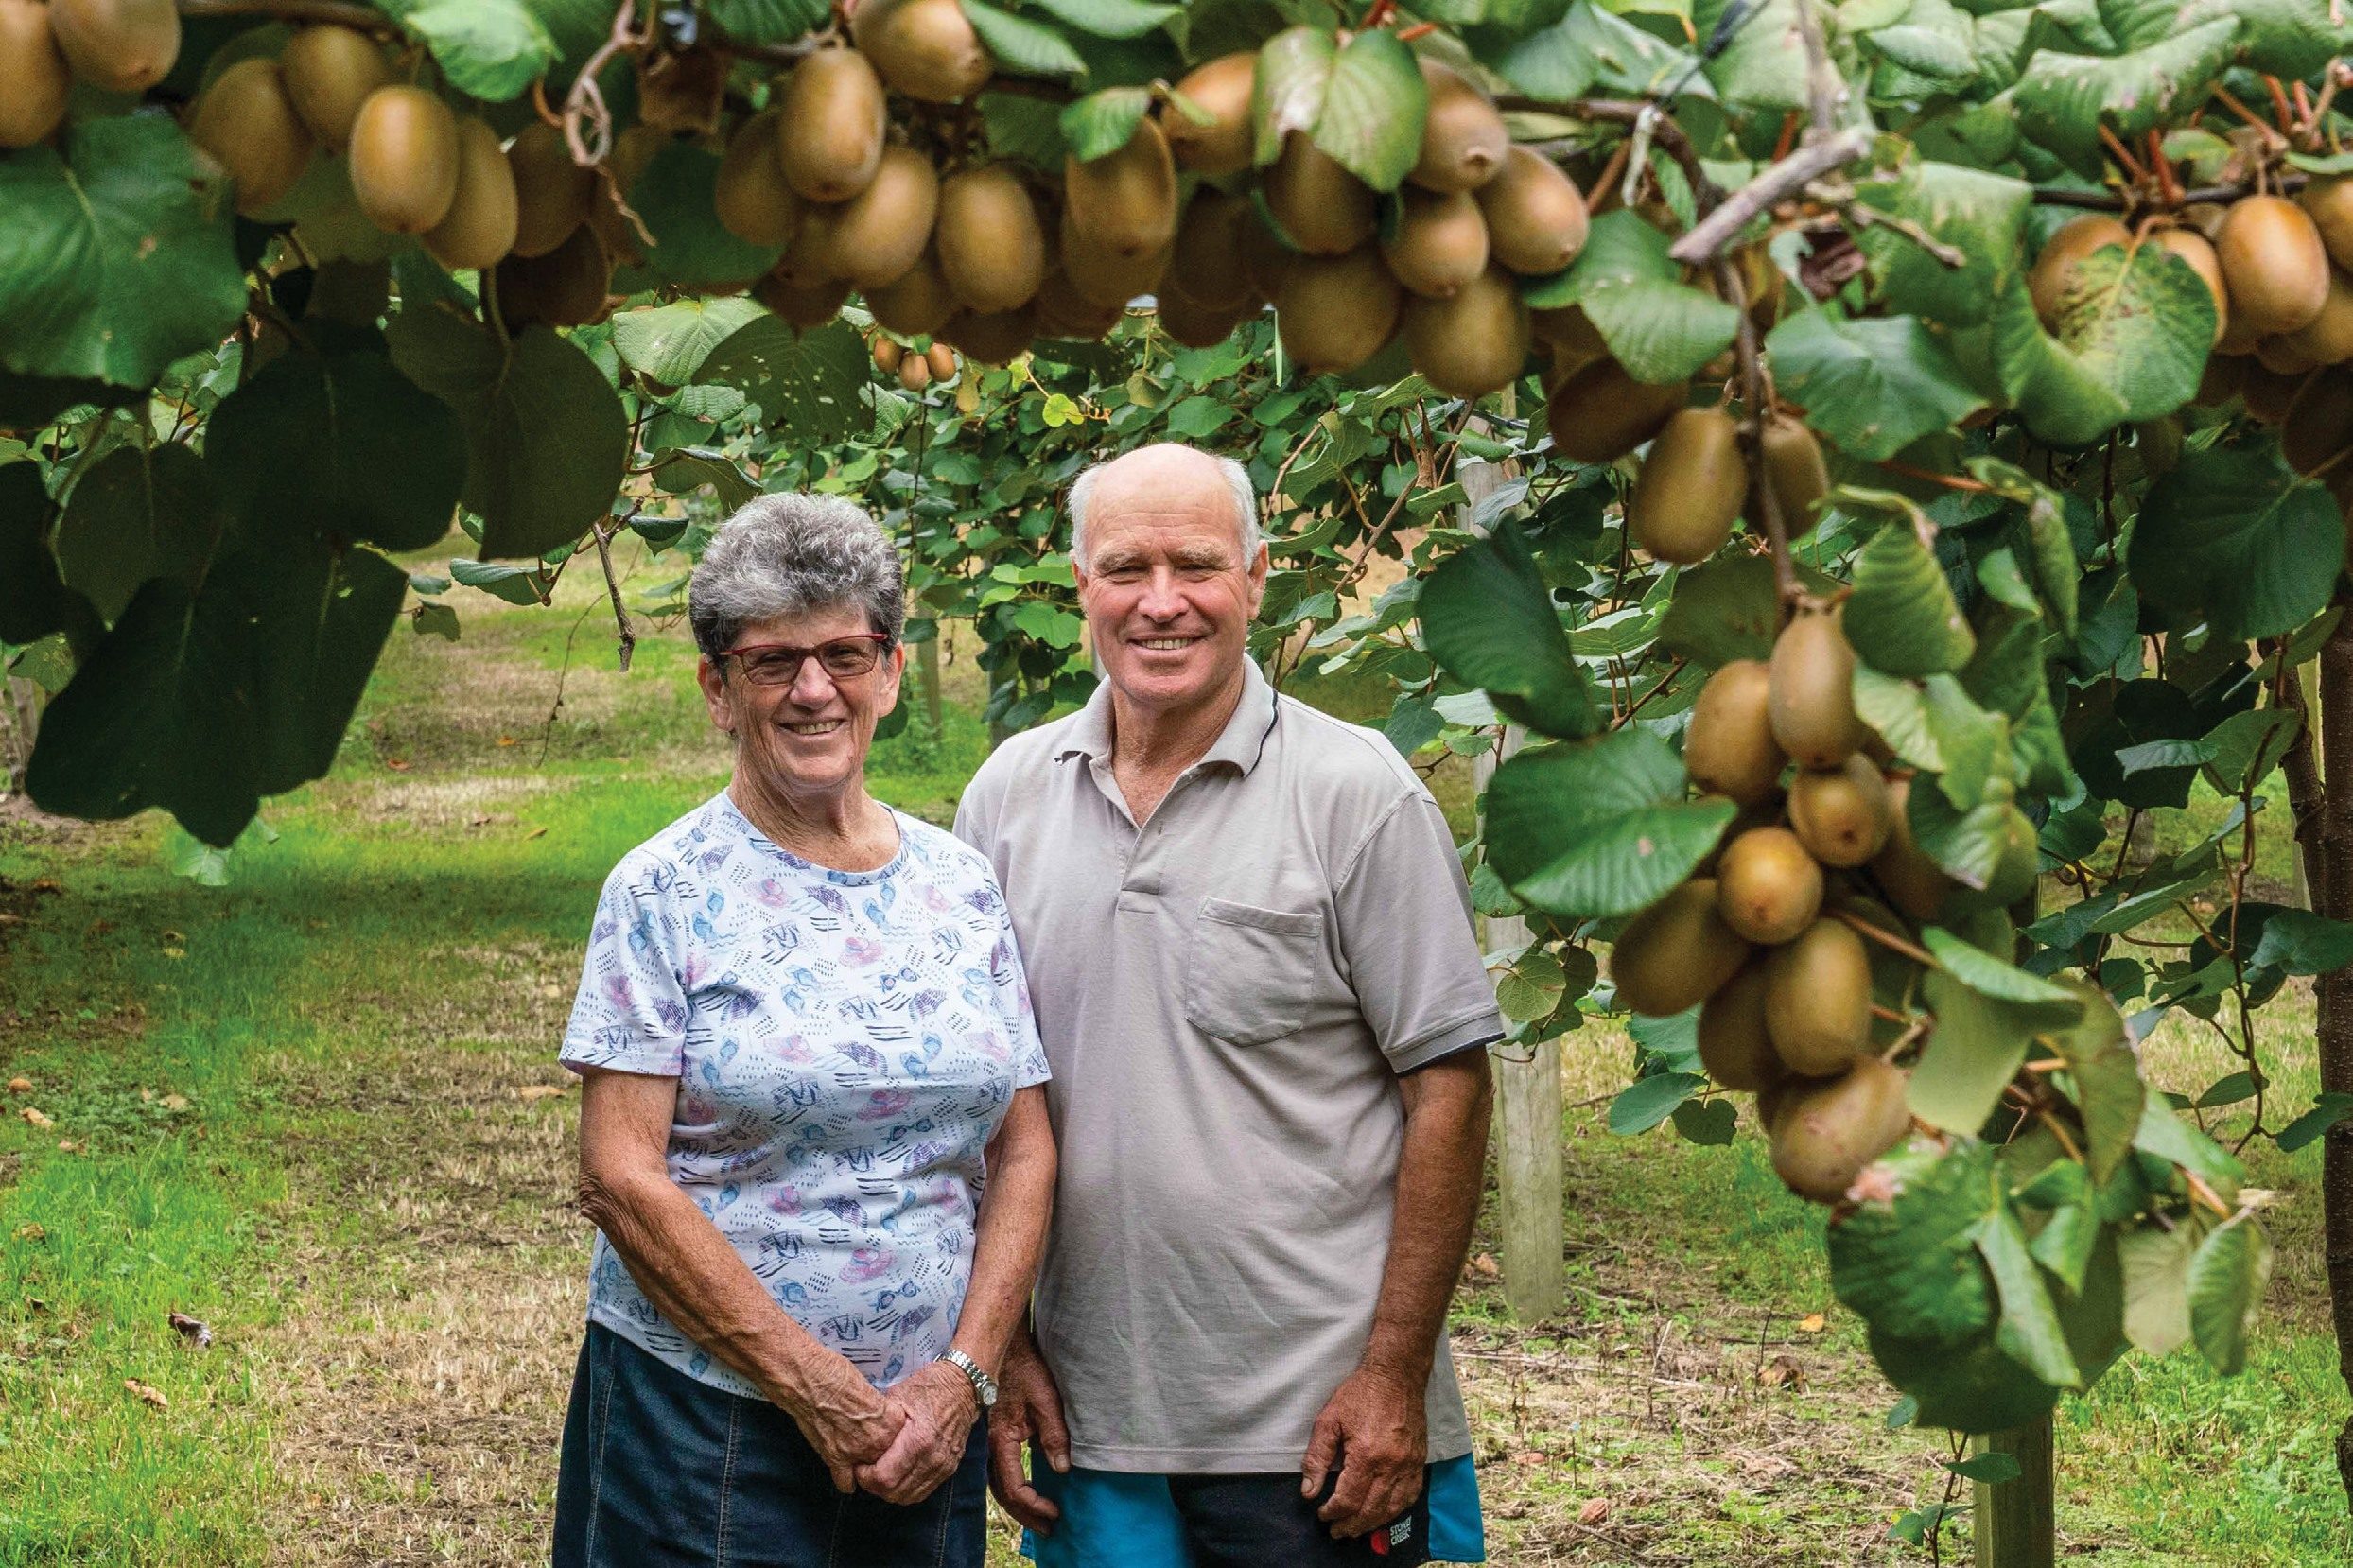
Monthly benchmarking and tweaking for continual improvement of physical and financial performance has helped South Wairarapa dairy farm owners Donald and Pat Wood hit all of their dairy farming targets.
For Donald and Pat Wood, their aims were clear when they went dairy farming, that the family farm, Paharakeke, now running 350 cows, would provide a business to grow their equity and be freehold by the time they came to retire.
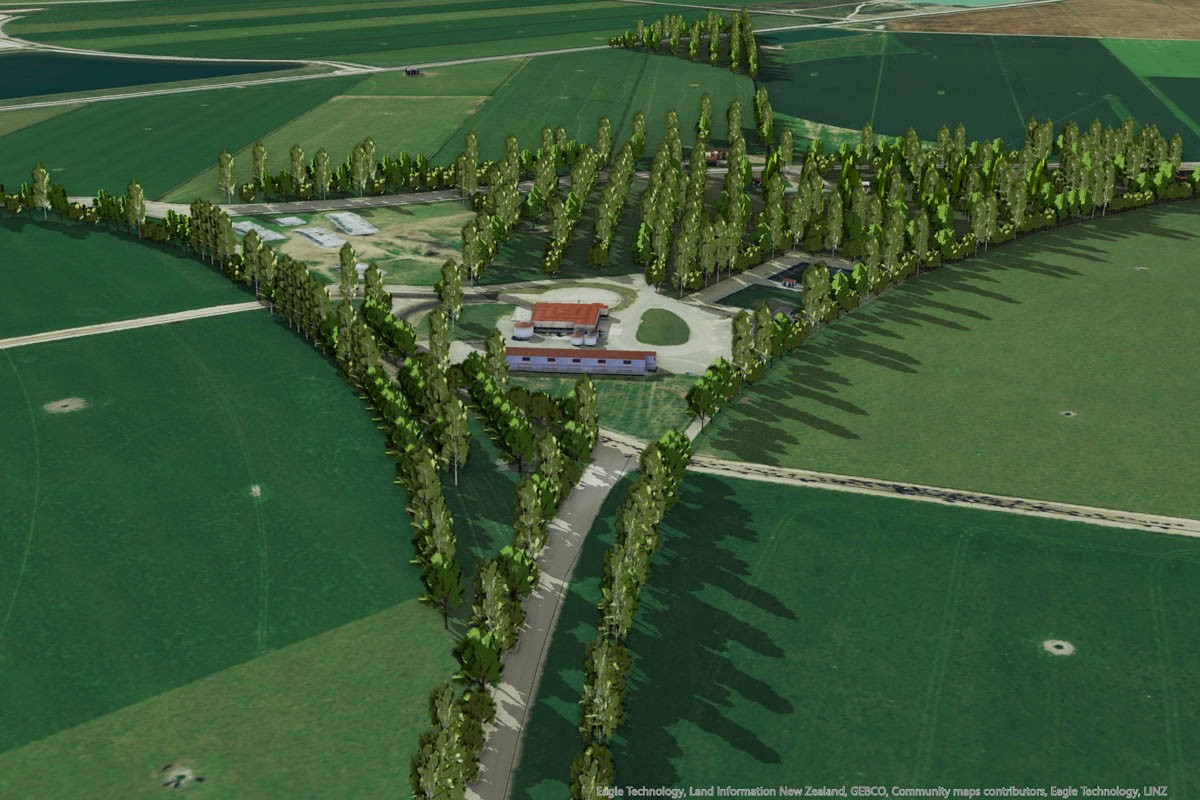
Donald got started early, forming a partnership with his father (who had been a dairy factory worker before joining the family farm) and his mother, one third each, in 1970. The 160-hectare Pirinoa property is half hilly and half flat, with three gullies running up to the Aorangi Forest Park on the ridgeline and an effective area of 110ha. With an average annual rainfall of 1000mm, the Pirinoa area is prone to summer dry and the Woods’ installed irrigation 10 years ago, then expanded it five years later with a bore to cover 45ha to mitigate against the dry periods.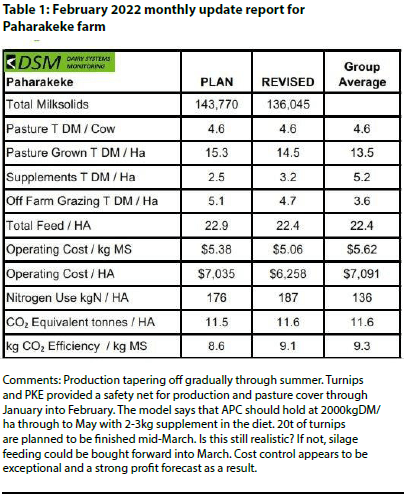
Donald says his style of farming was to take into account the farm is not easy country with the hills at the back, so he and Pat have always concentrated on profitability and not just per-cow performance.
“It’s not a horse race,” he says.
Benchmarking his physical and financial progress against other farmers has been a driver for him and Pat, made easier in the early 1990’s and the early days of farm comparison by engaging with Baker Ag Co and farm advisor Chris Lewis.
“We were one of the original clients on what became the Dairy System Monitoring programme when it started in 1999, we brought two properties into the group as we had bought another farm in 1993.”
“It’s been really really good, we can see monthly where we are sitting in the group – if we fall below the middle rankings I always ask myself why?”
“Of course it’s nice to be at the top – and we have been there a couple of times over the years – but generally I make sure I keep an eye on the costs and see how they flow through to the EBIT figures.”
Pat says the monthly input report is easy to fill in and send to the BakerAg office to generate the monthly report.
“We give them a monthly snapshot of what’s happening on the farm – things like the numbers of cows milking, milksolids, growth rates, feeding regime and pasture covers – it’s easy to fill in.”
A few days later the physical indices are matched with data from the farm’s financials and the model sends out a report comparing each farm on the programme for farm performance indices including EBIT/ha, operating cost/kg MS, pasture harvested in tonnes drymatter/ha, season’s feed costs/kg MS, cow efficiency in terms of kg milksolids/kg liveweight and giving an overall ranking. Here is where Donald has concentrated his analysis of his business – always keeping an eye on seasonal differences but watching the rankings, and always looking at his costs in relation to others.
He also appreciates the monthly update table for his Paharakeke farm. The physical indices around pasture grown and used, milksolids produced, supplements and off-farm grazing employed and nitrogen use per ha allow him to track his season to date progress alongside the targeted budgets and operating costs per kg MS and ha can help keep his costs down.
A recent addition has been the greenhouse gas numbers, introduced to the report to help the group’s farmers understand their numbers and then think about the GHG use efficiency by tracking CO2 equivalents per kg MS.
The report also contains timely remarks from the consultants crunching the data – reflecting something that might be happening on the farm or drawing Donald’s attention to an upcoming issue.
The real strength of the programme is that the information is live, showing what is happening in the current season, making it a proactive business planning tool, Donald says.
Now in their seventies and having built a portfolio of dairying interests, Donald and Pat are still involved on the Paharakeke farm, but have enjoyed having 50:50 sharemilkers Eddie and Janine Bosch join them in their business over the past four years. The younger couple in their late 20s have also embraced the benchmarking system, and pay half of the cost with Donald and Pat.
“We get much more value out of the information than the money we pay for it,” Eddie says.
Eddie runs a System 3 operation, with the mainly Jersey herd they purchased from the Woods producing 140,000kg MS/year (1272kg MS/ha) and around 400kg MS/cow.
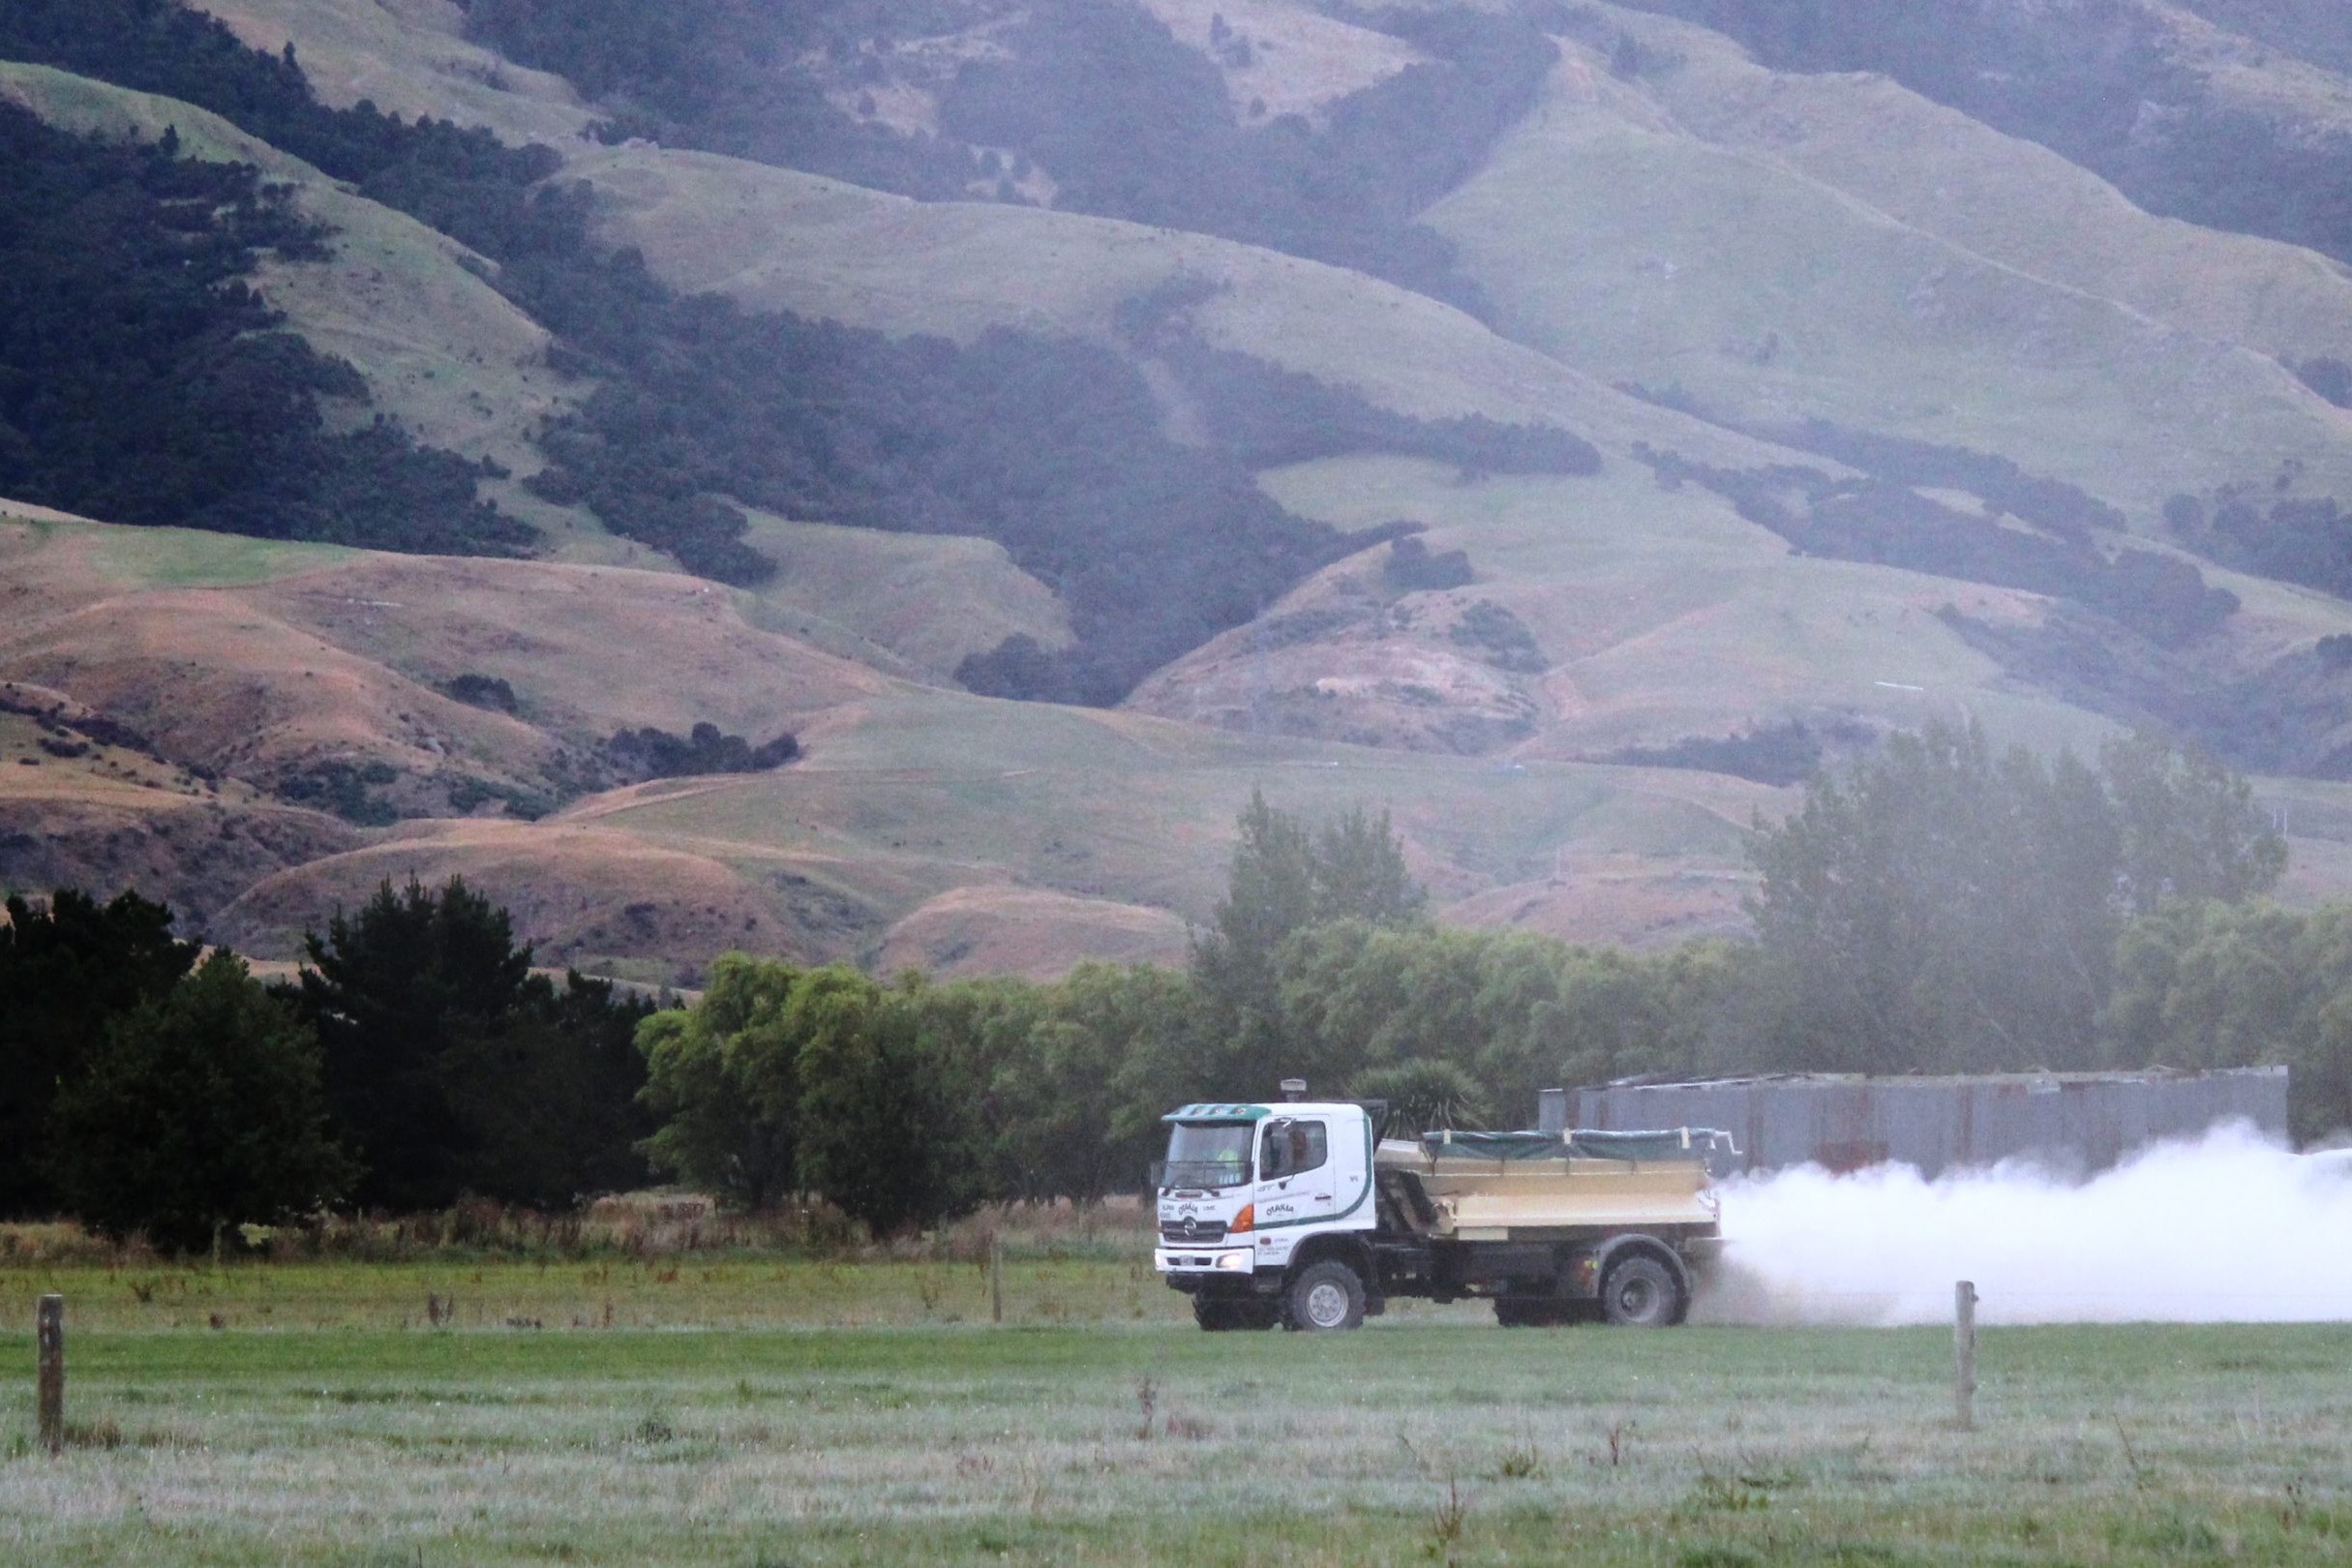
“We have managed to lift the production from 110,000 kg MS using silage and hay from the runoff and using 60-80t of bought-in supplement of palm kernel and dried distillers grain.”
Pasture only until November, Eddie then feeds DDG and palm kernel through November and December to cover a feed deficit there, switching to grass silage (made on the runoff) fed from Christmas through to April-May if short, alongside the 8-10ha of turnips grown on the platform.
Eddie says the power of the DSM programme with the Farmax model behind it enabled him to model an alternate feed shift away from maize silage to palm kernel and DDG and homegrown grass silage.
“We were able to enter in the inputs of different feed types, with their nutritional components and the quantity of the feed and Farmax was able to model a pretty accurate scenario of the increase or decrease in terms of production, and the impacts on cow condition, reproduction and health benefits.
“The modelling showed if the system change would be profitable and at what level of milk payout it would become profitable – that has been really valuable at a management level between us as sharemilkers and the farm owners and we were able to make the sensitive system change with a level of certainty that it was going to work.”
Eddie also appreciates the ability to compare the farm system with other operations and with many previous season’s results from Paharakeke.
“Using previous seasons’ farm information with budgeted data we are able to combine that and form a plan on what quantity of feed and pasture we will have or need for the remainder of the season and what the levels of milk production we will be at.”
“Because the programme continually updates and compares our budget to what we are actually doing it’s a way to be ahead of the markets if we are looking at bringing in extra feed or at changing our cost structure.”
“It is such a great tool to have so that we can compare with other farm businesses on a monthly basis as to what their physical data is vs cost/ cow, kg MS or kg/ha. And it’s live information as it’s updated monthly.”
Eddie and Janine are expecting their first child this month and plan to stay sharemilking with the Woods as long as possible, while taking an opportunity to invest in a farm ownership partnership on another property.
“I can see the DSM monitoring will be really helpful for potentially tracking another farm business performance from a distance as well.”
Constant changes to dairy system monitoring
Dairy System Monitoring (DSM) was developed in 1999 as New Zealand dairy farming started asking important questions about farm systems, affordability of higher feeding levels and relative profitability across farms.
The Pirinoa (south Wairarapa) discussion group challenged Chris Lewis of BakerAg to develop a way to provide apples-for-apples comparison of physical and financial performance for different farms.
Twenty-two years later the tool that was developed has become a comprehensive service.
Interestingly two essential points embedded in the original tool have remained and are an important point of difference when compared to other benchmarking tools.
DSM is a tool to analyse the current season being farmed – not looking backwards at what has happened but looking out the front windscreen.
DSM is NOT anonymous. Members, with agreed rules around confidentiality, see each other’s information – with names at the top of each column.
“It’s tough love and no hiding from the microscope,” Lewis says.
With this tool/service participants could see how they were performing against planned results, why there are differences and what their peers were achieving. Changes to the original reporting via spreadsheets came in the early 2000s when Macfarlane Rural Business joined and investment was made in the DSM website which collated the data and generated the reports.
The next tranche of development was to join Farmax up with the DSM website. The power of this collective technology meant farm models and scenario planning was empowered by valid data. Farm-to-farm comparison can be within a consultancy firm, and across a group of participating firms, across a region, by farm system type and virtually any grouping of farms.
“This huge pool of in-season farm system information, with like analysis, gives vital insights into what makes for successful farm systems today,” Lewis says.
“The data collected in a consistent manner across firms and the monthly nature of the reporting process means a constant stream of decision-support information, analysis and reporting including environmental indices.”
Other consultancy firms have since joined this collective and DSM is transitioning over to ownership by Farmax as they step up to lead the next stage of development.