Anne Lee
Modelling done for Campbell and Martine Tait shows they should be able to slash nitrate (N) leaching on their largely self-contained operation and improve profitability all without cutting cow numbers – that’s the theory, now they’re putting it to the test.
They’ve started reducing winter crop areas in favour of wintering more cows on grass, lowered nitrogen use – in part by working on increasing other soil fertility factors, made irrigation adjustments and lifted the number of beef calves reared to weaner stage to make use of peak drymatter production and boost gross farm income.
The changes have come after progressively adopting some of the system changes modelled by Perrin Ag Consultant agribusiness advisor Leighton Parker as part of DairyNZ’s, Meeting a Sustainable Future, project.
It’s a five-year project which currently includes 43 farmers in the Selwyn and Hinds areas of Canterbury where farmers are facing impending and somewhat daunting nitrogen reduction targets to meet the regional plan.
DairyNZ project leader Virginia Serra says the aim is to work with the partner farmers and rural professionals to carry out in-depth analysis and identify the most appropriate solutions for the farm situation and then share those solutions and discussions with others.
Virginia says the project can accommodate up to 50 farms with the large number making it possible to reflect the huge variation in farm systems and situations, helping make the outcomes relevant to a wide range of farmers around the country.
 Farmers like the Taits, in the Hinds area must make N-leaching reductions of 25% by 2025 and 36% by 2030.
The cuts must come off their nutrient budget losses estimated for the baseline period of 2009-2013 and modelled as if the farm was operating at good management practice then.
The Taits’ farming operation, Clearbrook Farm, is part of the MHV Irrigation scheme which manages nutrient allocations for its farmers.
It is currently working out how reductions in nutrient losses will be managed but for the purposes of the modelling Leighton used the Overseer budgets for the farm and the support block to determine a baseline N-leaching loss of 85kg N/ha/year with Environment Canterbury’s Plan Change Two requirements assumed as the target nutrient loss reductions.
The support block was bought in 2014 and as a result they grew crops both there and on the home farm, enabling them to lift cow numbers.
The changes pushed them well above their estimated base line loss to 104kg N/ha/year in the 2016/17 season, before they embarked on the project.
At that point they needed to make what’s almost a whopping 40% reduction to achieve the 25% reduction from baseline by 2030.
While seemingly high at 104kg N/ha/year, the nutrient budget reflects virtually the whole nitrogen “footprint” for the operation – milking, wintering, young stock rearing and suppleme direction.
“We’d achieved some goals but this was a good way to get into the nitty gritty of what we were doing and really understand our drivers of nitrogen surplus and look at ways to mitigate losses under different systems,” he says.
After talking with the Taits Leighton modelled two scenarios:
Scenario 1. Low intensity focused on resource use efficiency.
- Reduce nitrogen fertiliser from 235kg N/ha to 142kg N/ha (40% reduction).
- Lift the dairy farm Olsen P status from 16-17 average to an optimum 30.
- Target high-loss activity such as cropping on less leaky soils.
- Reduce fodder and cereal crop area from 81ha to 57ha (30% reduction) and winter 200 cows on grass.
- Use catch crops to minimise bare soils.
- Lower sprinkler annual applications by installing a timer on the sprinkler pump (700mm/yr down to 465mm/yr)
- Increase the number of beef calves reared through to weaner stage from 30 to 300.
Scenario 2. Resource-efficient plus feedpad.
- Reduce nitrogen fertiliser from 235kg N/ha to 160kg N/ha (32% reduction)
- Scenario 1 actions 2, 3, 5, 6, 7.
- Reduce fodder and cereal crop area from 81ha to 49ha (40% reduction), have no autumn fodder beet on the platform and winter 200 cows on grass.
- 450-cow feed pad to capture urine on shoulders of milking season and winter months enabling it to be spread back on to pasture more evenly at other times of the year. Also provides the ability to feed maize silage to lower urinary N concentrations. About 275t DM maize fed from March to mid-September. Capital costs for feed pad assumed at $425/cow plus an additional effluent holding pond at $45,000.
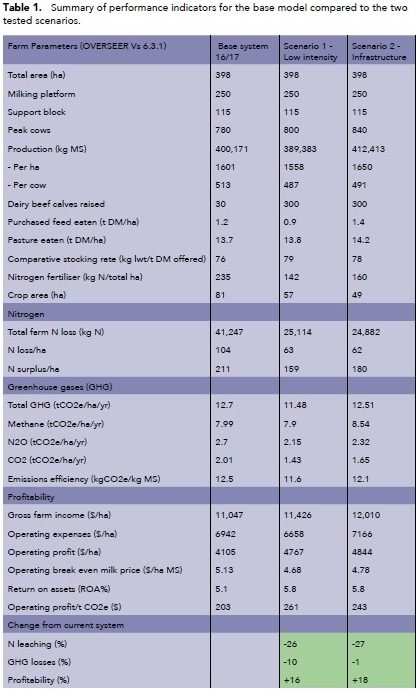
Campbell says he joined the project because, while he was making some headway he wanted more certainty in Table one shows the effects of each scenario on productivity, profitability, nitrogen losses and greenhouse gas emissions when assessed against the 2016/17 actual year.
The 2016/17 season is used as the benchmark comparison year because they began to implement some of the modelling options in the following season.
Both the modelled scenarios achieve the 2030 target of 63kg N/ha or less and both boost profitability significantly from the benchmark year.
Scenario two had the highest gross farm income from meat and milk but had higher operating expenses mainly because of an extra 200 tonnes DM of bought-in maize silage and the extra vehicle expenses in feeding that out along with extra costs from more cows milked.
Operating expenses were lowest for scenario one due largely to savings on bought-in feed and less cropping.
The main players
The modelling showed that cutting back the cropping area to winter 200 cows on grass combined with lowering the N fertiliser on the crops dropped N loss associated with cropping by 63% and 70% respectively for scenario one and two, equivalent to 30kgN/ha and 33kg N/ha.
Leighton says cropping can account for losses of between 80-400kg N/ha, depending on the stage in the crop rotation.
That compares with losses under pasture of 55kg N/ha.
Crops at Clearbrook include fodder beet – some on the platform for autumn – and sugar beet, on the support block for lifting, along with kale, as well as cereal catch crops.
Campbell’s taken on board this suggestion and has gradually been reducing the total area in crop from 65ha (21ha of that was grown on the home farm) to 56ha last winter with the plan for 48ha this coming winter.
“I do go around in circles a bit thinking about how to get that bulk of feed (lost from crop back from grass).
“We’ve got to be disciplined in the autumn so we know we’ll meet (higher) body condition score targets by the end of the season – it will come down to watching culling dates, dry off dates and once-a-day milking,” he says.
He then needs to go into the winter with a higher cover on the winter grass paddocks to get more growth through that period and have a buffer built in to fall back on in case of extended wet weather.
Later calvers could be moved from grass to kale later in the winter.
“There are a few options of how to do this practically, we have to think a bit out of the box with it if we’re going to winter that many cows that way,” he says.
While it creates some pressure through the autumn and possibly winter if it’s wet, there’s upside in the spring when instead of 210ha of milking platform he’ll have another 20-25ha of grass.
Cutting nitrogen fertiliser was a big player in overall reductions in modelled N loss accounting for 24% of the overall reduction in scenario one and 19% in scenario two.
It was achieved by eliminating the May application, cutting down or eliminating applications in zones such as gateways, troughs, fronts of paddocks and stock camps as well as using deep nitrate testing to determine crop N requirements.
Campbell has cut out the May application and reduced application rates generally although he’s found it’s important not to cut down the earlier-season applications when response rates are best.
He’s maintained them at a 30kg N/ha rate and dropped the subsequent applications to 25kg N/ha.
The model also called for lifting the low Olsen P levels to boost fertility and compensate for some of the reduced N fertiliser.
Campbell has been lifting Olsen P using variable rate fertiliser spreading after soil testing right down to a one-hectare grid showed a big range in Olsen P levels and a low overall average of 16.
Much of the farm sits between an Olsen P of 12 and 20 and the aim is to lift it to 30.
Although the sprinkler irrigation area only accounts for 8.4% of the total area, the lower application rate and subsequent reduction in drainage events, thanks to a timer being installed on the pump, reduced whole farm leaching by 6kg N/ha/year and contributed 9% to the total N reduction in the models.
It’s low-hanging fruit and something Campbell was quick to adopt.
Rearing calves to weaner stage was aimed at making use of peak pasture production on the support block and increasing farm income, with the timing of their sale getting them off before the risky autumn winter leaching period.
Campbell says the margins used originally haven’t been as good this year and while keeping them through to weaner stage does bring in more total income there’s a push and pull dilemma over feed.
“If they’re eating that surplus, we’re missing out on harvesting that to create high quality silage for the cows – and if we have to go to the market to buy extra feed that just pushes cost into our core business.”
In the model, while the feedpad didn’t directly reduce the total amount of crude protein eaten despite lower protein maize silage being included in the diet over the higher risk late summer and autumn periods it did allow the nitrogen captured from the pad to be spread back evenly at times when it was less likely to be leached.
Total leaching losses were similar to those in scenario one even though there were 40 more cows.
The capital cost of the feedpad and effluent area was estimated at about $500,000 and while the return on assets was similar to scenario one taking on additional debt in the current banking environment can be difficult.
Both scenarios have their pros and cons and Campbell says at this stage he’s not convinced that adding infrastructure is right for their situation.
“I think things are pointing us more and more towards the low-intensity type scenario but there are some practical challenges with that too.
“The margins in selling weaners aren’t there like they were so that does affect the profitability of that scenario and we’ve got some challenges in moving to more grass wintering.
“I’ll tell you after this winter,” he says.
Catch crops have their challenges too – getting them in the ground on time and achieving reasonable yields and then fitting the resulting silage back into the system, he says.
He’s keen to try options such as growing a diverse mixed crop and strip drilling other crops into it such as maize or kale.
“We’ve made some good initial progress with what we’ve done so far but we’ve got a long way to go to get the reductions we need.
“The modelling gives you a better idea of what areas to target – it gives you confidence to take some of the leaps we have to.”
Farm facts
2018/19 season
- Owners: Tait Family trust
- Area: 250ha milking platform
- Cows: 820 crossbred
- Farm System: Four
- Production: 479kg MS/cow, 1572kg MS/ha
- Wintering: Support block and platform
- Support block: 123ha owned
- Nitrogen: 203kg N/ha
- Pasture and crop eaten: 3t DM/ha
- Six-week in calf rate: 67%
EMISSIONS
Greenhouse gas emissions (GHG)were cut by 10% under scenario one.
A lower drymatter (DM) intake per hectare reduced methane emissions and less fertiliser N dropped nitrous oxide emissions.
Carbon dioxide emissions dropped by 29% thanks to less supplement and fertiliser use too.
The feedpad option shows similar total GHG emissions to the base scenario but increased methane due to more supplementary feed and a higher drymatter intake.