Sheryl Brown
The answer to the amount of nitrogen being excreted in cows’ urine could already be on farmers’ milk dockets.
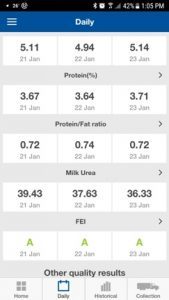
The milk urea concentration (MU) figure farmers see on their daily bulk milk test report has a strong correlation with the amount of nitrogen cows are excreting in their urine, CRV Ambreed head of research and development Phil Beatson says.
“Overseas studies and some local research shows there is a very robust relationship between milk urea concentration (MU) and urinary nitrogen (UN) and that this relationship is very strong when the averages of groups of cows are considered. This makes bulk milk MU information particularly interesting because the bulk milk MU value for the herd is effectively the average MU of that large group of cows.”
“A simple calculation allows farmers to know how much nitrogen their cows are excreting through their urine, providing an accurate picture about the nitrogen load, from urine, on their land.”
This information is valuable: it replaces the need for modelling tools having to estimate the amount of nitrogen loading to work out a figure for nitrogen leaching.
Modelling is a move towards getting more accurate predictions for nitrogen leaching, CRV Ambreed managing director Angus Haslett says.
Today, regional councils rely on predictive modelling tools to provide farmers with leaching levels. These tools estimate nutrient movements on farms, based on modelling information related to feed and fertiliser, animal numbers, rainfall etc.
“We believe the MU data on the bulk milk test report provides a useful indicator of the urinary nitrogen load. We are working with our partners to confirm the milk urea and urinary nitrogen relationship is robust to enable these important conversations to take place in New Zealand.”
CRV Ambreed has broached this concept with industry bodies including DairyNZ, AgResearch and leading dairy companies.
Once the relationship for NZ conditions is confirmed all farmers will be able to use MU to accurately determine the amount of nitrogen hitting the ground as urine on their farms every day, Beatson says.
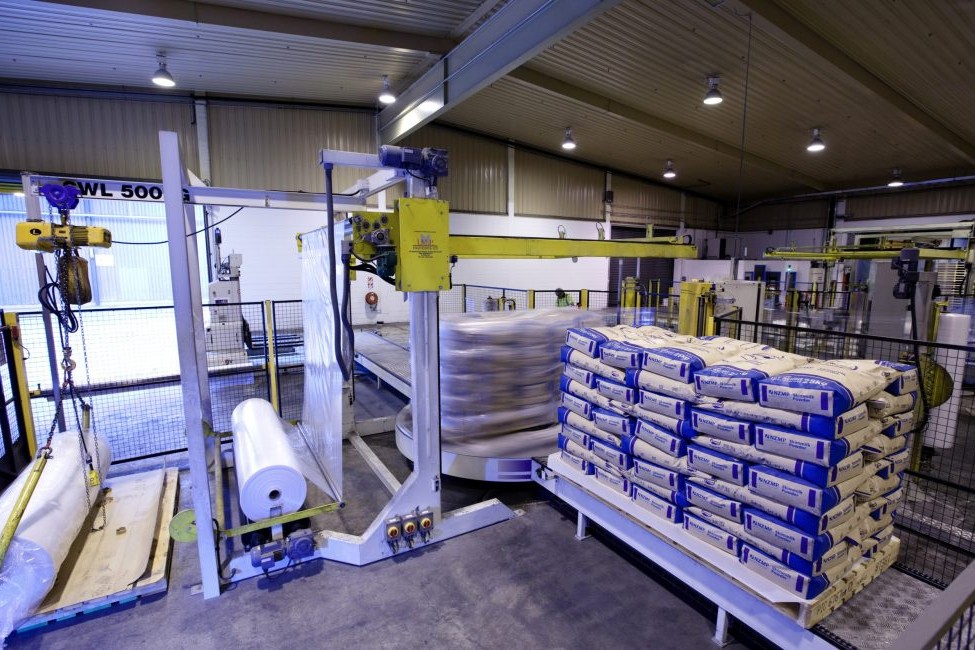
MU values are provided to farmers supplying Fonterra, Open Country Dairy, Synlait and Westland Milk Products. The values are measured in the daily bulk sample by the milk testing laboratory along with fat and protein percentage and somatic cell count.
The bulk MU figure is used by farmers as an indication of how much surplus nitrogen is being feed to the cows.
The average MU value in NZ is 30 units. An overall drop of two or three points nationwide would provide a 20% reduction in nitrate leaching, Beatson says.
MU is an indicator of how much dietary nitrogen is not being used for milk production and is being wasted, with about 45% of dietary nitrogen excreted in cows’ urine.
“The literature I’ve read indicates that bulk MU is a very precise estimate of the amount of nitrogen that the average cow in that herd is peeing out. Further, the MU-UN relationship seems remarkably similar for different groups of cows,” Beatson says.
Beatson came across the relationship between MU and UN through CRV Ambreed’s investigation into the genetics of milk urea nitrogen (MUN).
MUN is the nitrogen content of milk urea, just like fertiliser where a 40kg bag of urea is 46% nitrogen and contains 18.4kg nitrogen, so MUN is 46% of MU.
CRV Ambreed developed a breeding value for Milk Urea Nitrogen (MUN) concentration last year which selects sires to produce progeny that excrete less nitrogen in their urine.
Progeny from those LowN sires that would be born this year are expected to produce 1.3 fewer MU units than progeny of average bulls, Beatson says.
“We predict, over time, breeding will reduce MU by four or five milk urea units compared to today’s average dairy cow – that would reduce the bulk MU average from 30 down to 25.
“That would be huge environmentally.”
CRV Ambreed research has shown milk from cows with lower MUN contained a higher proportion of milk protein.
Theoretically as the milk urea figure comes down farmers will see a modest increase in milk protein percentage, he says.
“It appears up to 25% of the nitrogen being diverted away from milk urea is going into milk protein.”
The ongoing solution to lowering MU and ultimately nitrogen leaching would be through genetics and feeding.
“We are looking to have dairying systems that are more sustainable. The ideal situation is to lower urinary nitrogen to a level that ensures environmental and economic viability.”
More research sought
NZ data shows a lot of variability with MU and UN levels, DairyNZ strategy and investment leader for productivity Bruce Thorrold says
“MUN is a useful indicator of nitrogen status, but it’s a big step to being able to use it as a predictor of leaching.
“From data that we have the relationship between MU and UN there is much more variable than overseas data seems to suggest.”
That variability is probably due to the NZ pasture system rather than cows in barns overseas, Thorrold says.

It is also important to remain looking at the amount of nitrogen cycling in the system at a per-hectare basis not a per-cow basis, he says.
Thorrold warns farmers that managing MU levels down by feeding cows feed with lower levels of nitrogen, such as grain, on top of feeding pasture could increase the amount of nitrogen in the system.
“The concentration in milk can go down, but at the same time there is more nitrogen going around the system.”
DairyNZ thinks the relationship between MU and UN is a useful concept to explore, however.
The genetic research on CRV Ambreed’s LowN Sires would involve collecting a lot of data on MU and UN relationship to be able to test this concept in future, Thorrold says.
It is also encouraging to see commercial partners like CRV Ambreed coming out with new ideas and tools.
“It’s great to see the commercial sector innovating and finding ways to help farmers. And DairyNZ are happy to talk with anyone who has a good idea.”
The genetic potential of LowN Sires, the exciting research involved with plantain and the results of the Pastoral 21 are examples of developing tools farmers can use to manage sustainable systems going forward.
“We are starting to build up tools that can make a serious difference. Compared to five years ago I’m a lot more confident we can manage our way through this.”
There is cautious optimism among scientists that this finding could be used as a tool in the dairy industry, AgResearch principal scientist Stewart Ledgard says.
Further research is needed to look at the relationship in a NZ context under a grazed pasture system, however.
“We too would add a caution that the relationships have been largely based on northern hemisphere studies with housed cows and controlled feed system that have normally been under lower protein levels than our NZ pastures.
“We feel there is a need for some research under those higher protein levels of our grazed pasture systems.”
Scientists would also need to look at what it means for the physiological effect on the cow if MU levels are lowered.
“If you’re lowering the UN excretion, what’s actually happening to the nitrogen eaten by the animal. It’s important we understand those mechanisms, where it’s being partitioned and the factors of that.
“If you’ve still got the same broad levels of nitrogen intake by animals, then presumably it’s being redirected into milk, dung or body weight.”
This information also had to fit into the NZ farm system that has a lot of variables affecting nitrogen leaching, including stocking rate, soil type, rainfall, and different times of year.
Haslett confirmed the need for the further work and reiterated the need for the likes of AgResearch and DairyNZ to move quickly to help NZ farmers.
Research and ideas like this should be coming from industry bodies – so it’s good to see collaboration to work with us on this, he said.
“We don’t have a great track record of preventing problems in agriculture we seem to go around fixing them. It’s time to try and reverse this and CRV is prepared to put the effort in to help.
“The opportunity we have here is too valuable to rely on guess work. It’s time we took a far more proactive approach and got on with realising if these gains are possible – it’s critical to the future of NZ’s economy – every single person not just dairy farming. Any apathy in this area should be rigorously challenged.”
For each 1-unit increase in Milk Urea concentration (MU) there is an increase of 7g of nitrogen excreted as urine. For the average NZ situation with a MU of 30, on average each cow will be urinating 210g nitrogen per day.
It’s likely that the MU-urinary nitrogen relationship found in international studies would hold true in NZ – or at least the direct relationship with perhaps a slightly different slope, Beatson said.
Instead of 7g of urinary nitrogen per unit of MU the best value for NZ may be 6 or 8.
A relatively small investment to confirm the MU and UN relationship could determine this quite quickly, he said.
Nitrogen excretion calculation:
The amount of nitrogen excreted by the herd each day can be calculated as: MU x 7 x number cows. If a herd of 500 has MU of 30 then the amount of nitrogen hitting the ground in urine is 30 x 7 x 500 = 105,000 grams N per day (105 kg N per day). Divide that number by the number of hectares the cows have grazed that day to get the urinary nitrogen/hectare/day.